Analyse de marché

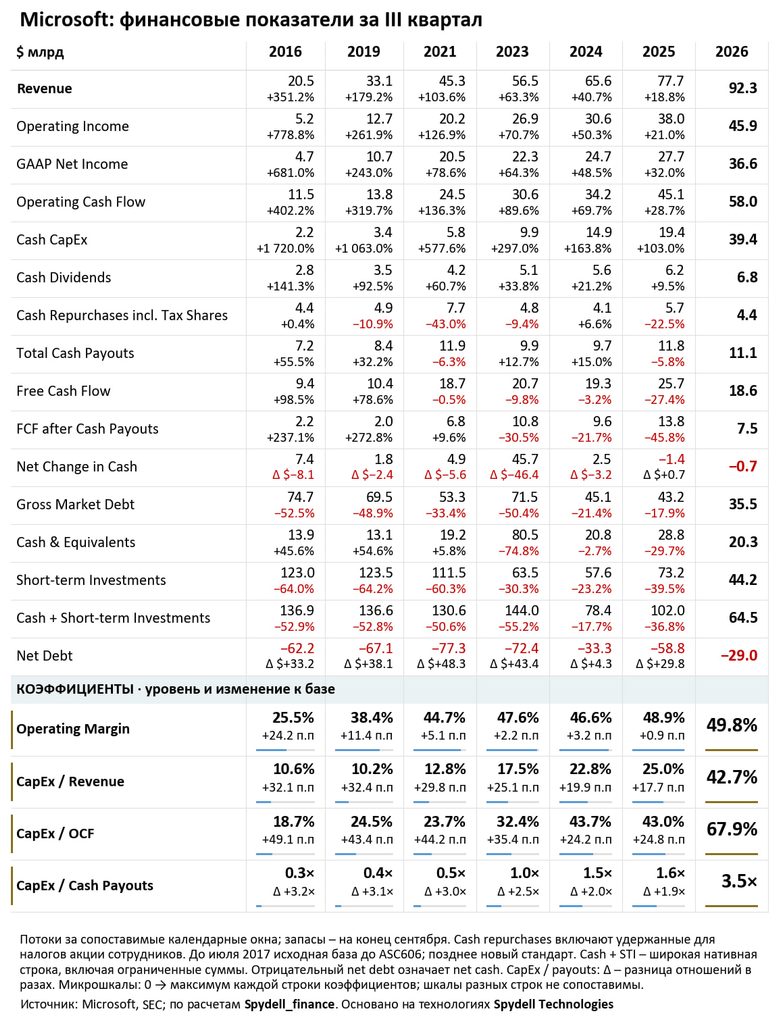
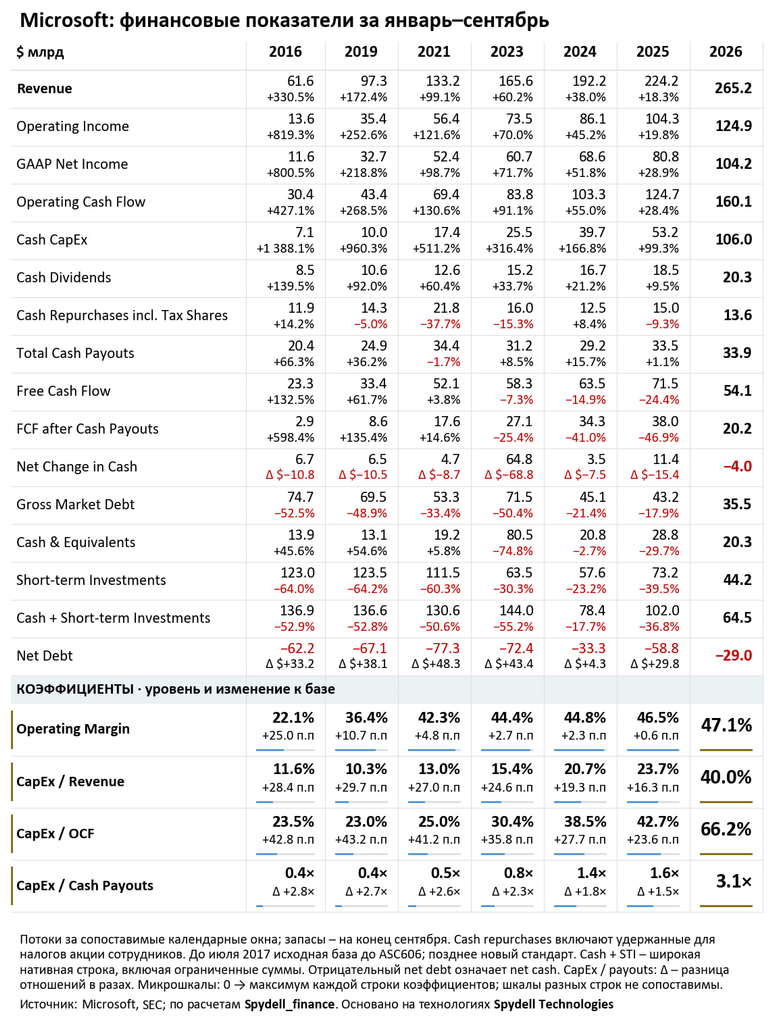
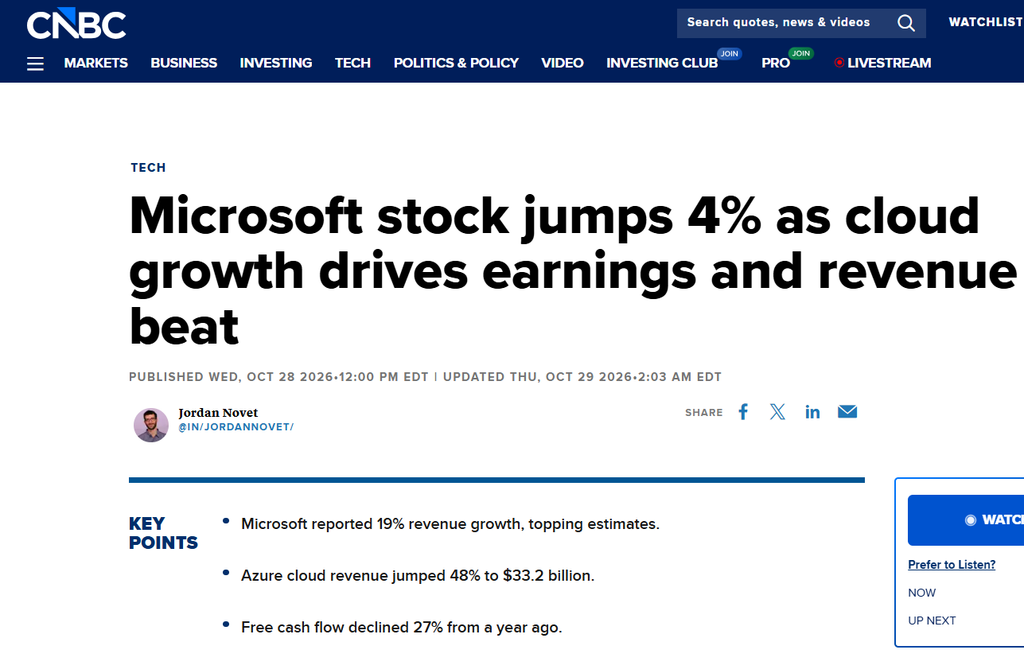
Microsoft’s FY2026 Q3 results reveal a structural shift in the economics of hyperscalers: despite revenue growth of +19% year over year to 92,3 Mds and Azure growth of +48%, supported by a 677 Mds $ backlog, rising capital intensity is temporarily eroding shareholder value. CapEx is projected to reach 42,7 % of revenue in FY2026, compared with 10,3 % in 2019. Microsoft nevertheless remains the only hyperscaler generating positive free cash flow (FCF), at 18,6 Mds in Q3 and 54,1 Mds over nine months, supported by diversification across Azure, M365 Copilot and OpenAI. However, return on invested capital (ROIC) has declined from 29,3 % in FY2024 to 25,5 % in FY2026, while OpenAI contributes 10,0 Mds $ in quarterly revenue, approximately 11 % of total revenue. A stochastic discounted cash flow (DCF) valuation incorporating concentration and excess-capacity risks estimates intrinsic value at 325 to 400 per share, below the approximately 499 $ market price on 1 September 2026 and the adjusted earnings multiple of 26,9x.
Azure generated 33,17 Mds $, growing 48 %, above the 44 % consensus expectation. However, this headline growth conceals substantial dependence on OpenAI. Excluding its 10,0 Mds $ contribution, underlying enterprise growth is estimated at approximately 25,8 %, using a model that attributes 30,1 % of Azure revenue to OpenAI and assumes 100 % growth in that contribution. Organic Azure growth is therefore approximately 26 %, 22 percentage points below the reported rate, meaning that around 30 % of cloud growth depends on one customer.
Microsoft is increasingly monetizing Copilot through consumption-based billing rather than subscriptions alone. The number of customers consuming credits increased by more than 75 % during the quarter, while paid seats exceeded 30 million in T2 FY2026. Nevertheless, the Productivity and Business Processes gross margin fell from 69,05 % to 67,20 % over three quarters because of increased Copilot consumption. The analysis suggests that inference costs currently outweigh the incremental revenue benefits, weakening operating margins.
OpenAI represents a significant counterparty concentration risk, generating 10,0 Mds in quarterly revenue for Microsoft, approximately 11 %, compared with 6,0 Mds $ in the previous quarter. Its cash consumption reportedly exceeds its payments, creating balance-sheet exposure. Applying the Merton (1974) credit-risk model, the analysis estimates that OpenAI’s implied probability of default justifies a 150 to 250 basis-point risk premium on related receivables, which is not reflected in Microsoft’s financial statements.
ROIC declined from 29,3 % in FY2024 to 25,5 % in FY2026, while the estimated weighted average cost of capital (WACC) is 8,5 %. With NOPAT of approximately 124,9 Mds over nine months and invested capital of 500 Mds, estimated economic value added (EVA) remains positive at 82,4 Mds $, although value creation is slowing. The analysis warns that marginal investments could destroy long-term shareholder value if their returns fall below the cost of capital. Saturating AI demand could also reduce perpetual growth assumptions and further compress Microsoft’s valuation multiple from 37,8x to 26,9x adjusted earnings.
Financing increasingly relies on leasing. Financial lease liabilities reached 71,0 Mds, operating lease commitments 27,5 Mds, and leases not yet commenced 364,6 Mds $. Including leases, adjusted debt-to-EBITDA is approximately 1,8x, compared with 0,1x in standard databases. The analysis argues that Basel III-related risk weighting of AI infrastructure financing could increase Microsoft’s cost of capital by 50 to 100 basis points by 2027.
Although Microsoft is the only hyperscaler with positive Q3 FY2026 FCF, at 18,6 Mds $, this represents a 27 % year-over-year decline and only 20,2 % of revenue, against approximately 30 % historically. CapEx consumed 66 % of OCF over nine months. AI infrastructure assets have useful accounting lives of 4 to 6 years but estimated economic lives of only 2 to 3 years because of technological obsolescence. Depreciation increased 56 % to 11,1 Mds $, reducing reported earnings without generating cash.
Reported net income was 36,63 Mds in Q3, but 32 of this result came from revaluing Microsoft’s OpenAI investment. Excluding this effect, net income growth was only 18,1 %. For FY2026, after-tax OpenAI gains of 4,963 Mds $ reduced the underlying earnings-per-share growth rate to 22 %, compared with the reported 31,6 %. Although the OCF-to-net-income ratio of 1,4x remains healthy, the FCF-to-net-income ratio of 0,51x indicates weaker cash earnings quality.
The report also highlights the AI productivity paradox documented at the World Economic Forum in Davos 2026: 89 % of organizations adopting AI reported no measurable labor-productivity improvement over three years, 56 % reported no tangible value, and only 10 to 12 % reported revenue or cost benefits. Microsoft is monetizing AI, but evidence that customers achieve a positive return on investment remains insufficient. Undisclosed Copilot net retention and growing usage-based adoption may indicate experimentation rather than lasting commitment, creating potential customer churn risks.
Finally, Microsoft’s 677 Mds $ remaining performance obligations (RPO) include 250 Mds from OpenAI. The backlog has a weighted average duration of 2,3 years, with approximately 30 % expected to be recognized within 12 months. Excluding OpenAI, backlog growth is 25 %, below the cost of capital. Assuming a 50 % operating margin and an 8,5 % WACC, the discounted backlog value is estimated at 280 Mds $, approximately 40 % of Microsoft’s market capitalization. The remaining valuation therefore depends heavily on perpetual growth and competitive conditions. A 10 000-iteration Monte Carlo simulation, varying perpetual growth between 2 % and 5 %, WACC between 7,5 % and 9,5 %, and operating margins between 45 % and 52 %, produces an intrinsic value range of per share at a 95 % confidence interval. The current 499 $ share price exceeds the 95th percentile, suggesting a speculative premium of approximately 20 %.