En chiffres
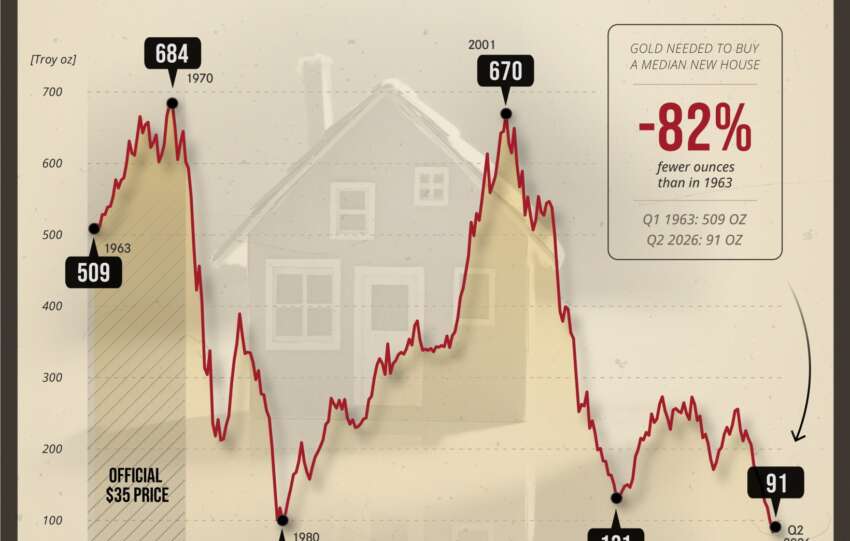
MiningVisuals' chart (1963–2026) shows the median price of a new house in the United States in troy ounces of gold. This is not merely a historical curiosity: it is a tool for measuring monetary distortion and a signal of an asset regime shift. The ratio fell from 684 ounces in Q1 1970 to 100 ounces…