En chiffres
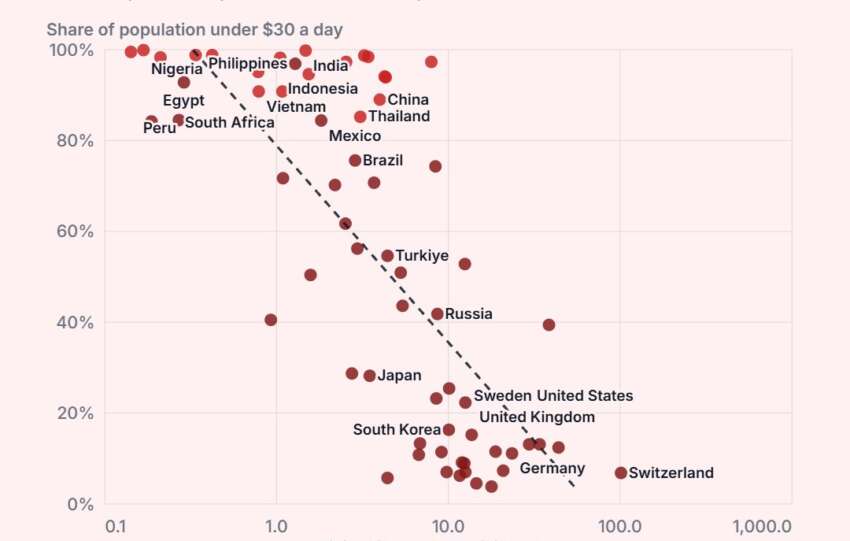
The graph presents a linear regression between billionaire density and poverty, with the equation Fit: y = 78.9 - 43.3 log10(x), R² = 0.581 and n = 64. A tenfold increase in billionaire density is associated with a 43.3-percentage-point decrease in the population living below the $30/day poverty line. However, this correlation does not establish…