Analyse de marché
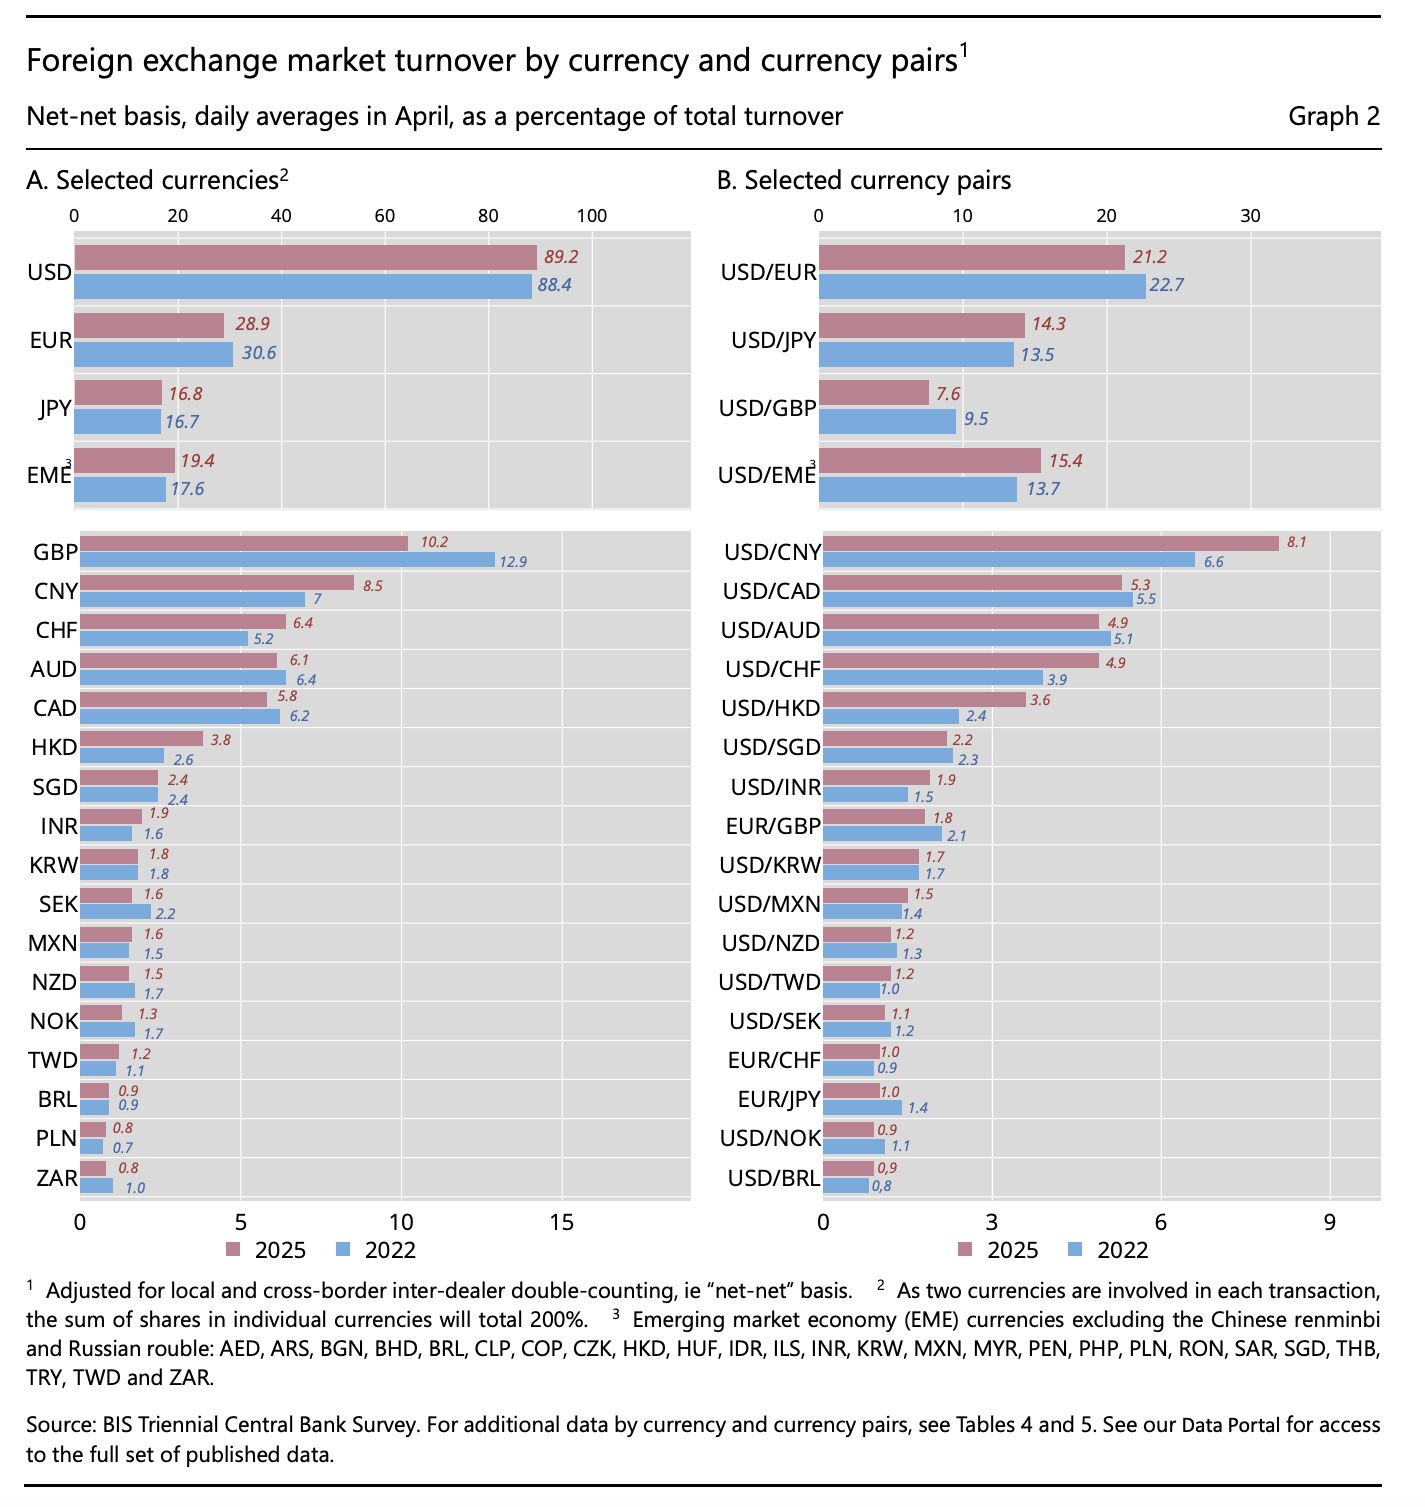
Share This Article
This analysis causally links macro-geopolitics (de-dollarization) to micro-speculation (AI bubble) and our investment thesis (Fed Pivot). The analysis of the text and image (de-dollarization) confirms that the financial environment is not stable, but its fragility is the driver of our opportunity.
MACRO & FINANCIAL ANALYSIS: DEDOLLARIZATION, DRIVER OF THE AI PIVOT AND BUBBLE
I. GEOPOLITICAL DIAGNOSIS: ACCELERATED FRAGMENTATION
Historical analysis of the five phases of the dollar demonstrates that dedollarization is now in Phase 5 (Monetary Fragmentation), characterized by an acceleration following sanctions.
(a) Post-2022 Acceleration: The fall in the USD share of global reserves shifted from a slow pace (7 points in 14 years, 2001-2015) to a rapid pace (7 points in 7 years, 2015-2022). Notably, the post-sanctions period (2022-2025) shows an even faster erosion (-2 points in 3 years), validating the impact of weaponization (the use of the dollar as a geopolitical weapon).
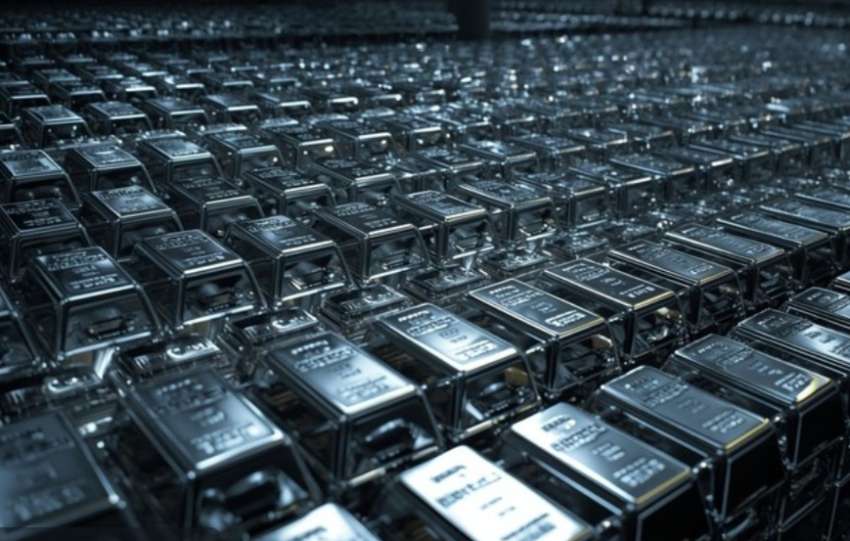
(b) Structural Beneficiaries: The analysis confirms that safe-haven assets and alternative currencies are the direct and long-term beneficiaries of this decline.
II. THE CAUSAL EQUATION: DEDOLLARIZATION → PIVOT → BUBBLE
This is the most important articulation point for the strategy. The text establishes a direct causal relationship between the fragility of the dollar and speculative overheating (AI Bubble).
1. The Debt Link (The Fed’s Constraint):
(a) Dedollarization means that foreign buyers of US debt (Treasuries) are decreasing (less recycling of petrodollars, etc.).
(b) This forces the Fed to maintain an easing policy (Fed Pivot, end of QT, liquidity injections) to finance the US deficit. The Fed becomes the buyer of last resort.
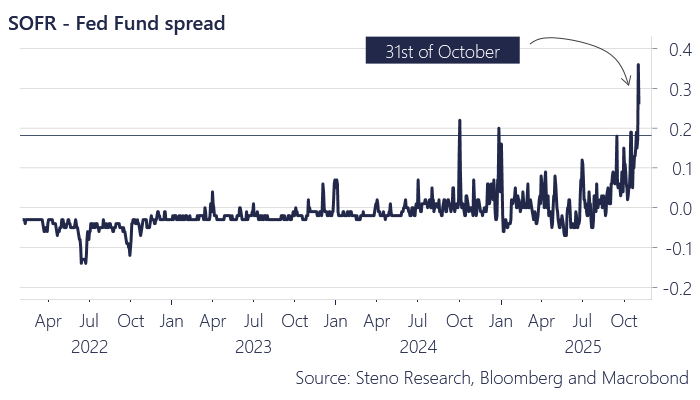
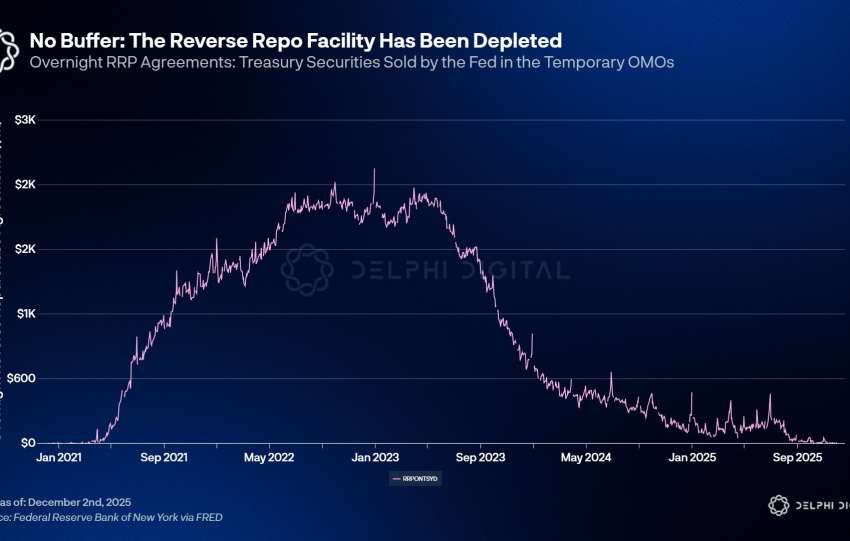
(c) Validation of the Pivot Thesis: The imperative to « save the TradFi system » (mentioned as PrimaLend, \$395 billion in losses) by injecting liquidity is not a choice, but a structural obligation stemming from the inability to finance debt through foreign buyers. The SOFR/REPO liquidity crisis is the symptomatic expression of this financing constraint.
2. The Flow Mechanism (The Bubble’s Fuel):
(a) Liquidity Overflow: When the Fed injects liquidity (disguised QE), this money must find an allocation.
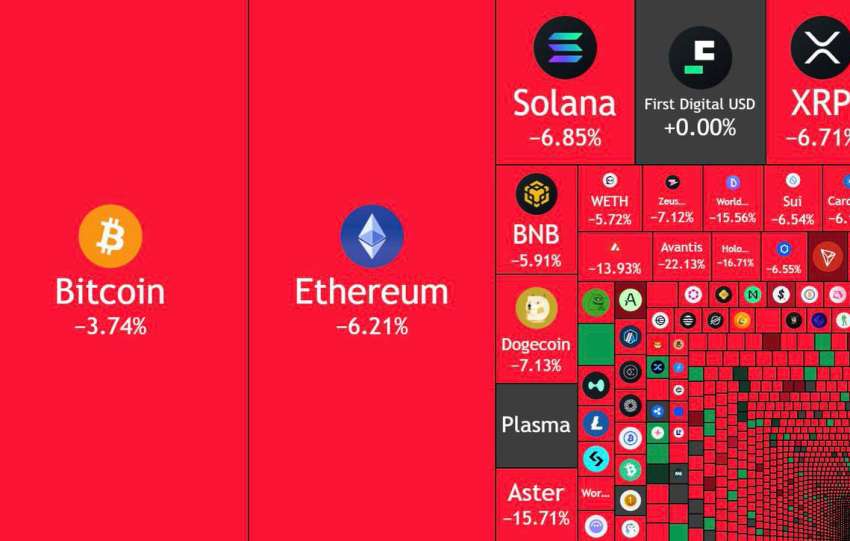
(b) Channeling: Rather than flowing into the real economy (which would be inflationary), some of it goes into safe-haven assets (Gold, BTC), and the other part rushes into the « most powerful growth narrative: AI. »
(c) Validation of the AI Bubble: This analysis confirms that the Mag7/AI Bubble (47.7% concentration and general overvaluation) is fueled by the surplus USD liquidity generated by the system’s survival imperative. As long as the Fed injects, the bubble inflates.
This analysis cements the global investment strategy:
(1) The Headwind is Structural: De-dollarization ensures that the Fed will be forced to inject liquidity (Pivot). This is not a one-off event, but a major geopolitical trend (Phase 5).
(2) The imminence of liquidity injection by the Fed, forced by the SOFR/REPO crisis and the inability to finance the debt, is the immediate trigger (mid-November).
a) Share of USD in world reserves: 57.7% (Q1 2025) vs 71% (2001) → -13.3 points in 24 years
(b) Lowest level in 30 years (last time below 58%: 1995)
(c) Acceleration post-Russia sanctions (2022): -2 points in 3 years (vs. a historical rate of -0.6 points/year)
(d) Beneficiaries: gold +134% (2015-2025), yuan +300% (since 2016), non-traditional currencies +250%
֍ I. Dedollarization is the key linking the AI Bubble to the rest of the financial system.
1. Liquidity and dedollarization: the fuel for the Bubble
¤ The link: dedollarization and the USD debt crisis force the Fed to maintain an easing policy (Fed Pivot, end of QT, liquidity injections).
¤ Consequence: this USD liquidity created by the imperative to save the TradFi system has to go somewhere. Some flows into safe-haven assets, but another part rushes into the most powerful growth narrative: AI (the 47.7% concentration phenomenon).
¤ Thesis: as long as the Fed is forced to inject liquidity to avoid the banking crash (PrimaLend, \$395 billion in losses), it involuntarily fuels the speculative AI bubble.
The 5 historical phases of dedollarization Phase
1: Bretton Woods (1944-1971) — pure hegemony Characteristics:
· USD the only currency convertible to gold ($35/oz fixed)
· Other currencies « pegged » to the dollar
· USD share of reserves: ~80-85%
End: Nixon Shock (August 15, 1971) — suspension of gold convertibility.
Phase 2: Petrodollar (1974-2000) — Indirect domination Mechanism:
· US-Saudi Arabia agreement (1974): oil sold only in USD
· Petrodollar recycling into Treasuries
· USD share of reserves: 65-71% (stable)
Peak: 1990s-2000s (fall of the USSR, globalization).
Phase 3: Gradual erosion (2001-2015) — rise of Euro Catalysts:
· Launch of the euro (1999-2002)
· Iraq/Afghanistan Wars (weakening of US soft power)
· 2008 Financial Crisis (loss of confidence in the US system)
USD Share: 71% (2001) → 64% (2008) → 66% (2015, rebound from the Euro crisis).
Phase 4: Geopolitical acceleration (2016-2022) — weaponization Catalysts:
· Iran sanctions (2018): SWIFT exclusion
· US-China Trade War (2018-2020)
· Russia sanctions (2022): freezing of CB reserves, SWIFT exclusion USD Share: 66% (2015) → 59% (2022) = -7 points in 7 years.
Alongside the decline in the dollar’s share of global fx reserves, there is evidence of dedollarization in commodity markets, with more transactions denominated in other currencies, particularly involving Russian oil exports to emerging economies.
Phase 5: Monetary fragmentation (2023-2025) — new System Characteristics:
· USD Share: 59% (2022) → 57.7% (Q1 2025)
· Emergence of credible alternatives: mBridge, CBDC, stablecoins
· Energy trade dedollarization (CNY, RUB oil) Projected USD Share 2030: 50-55% (at the current rate).