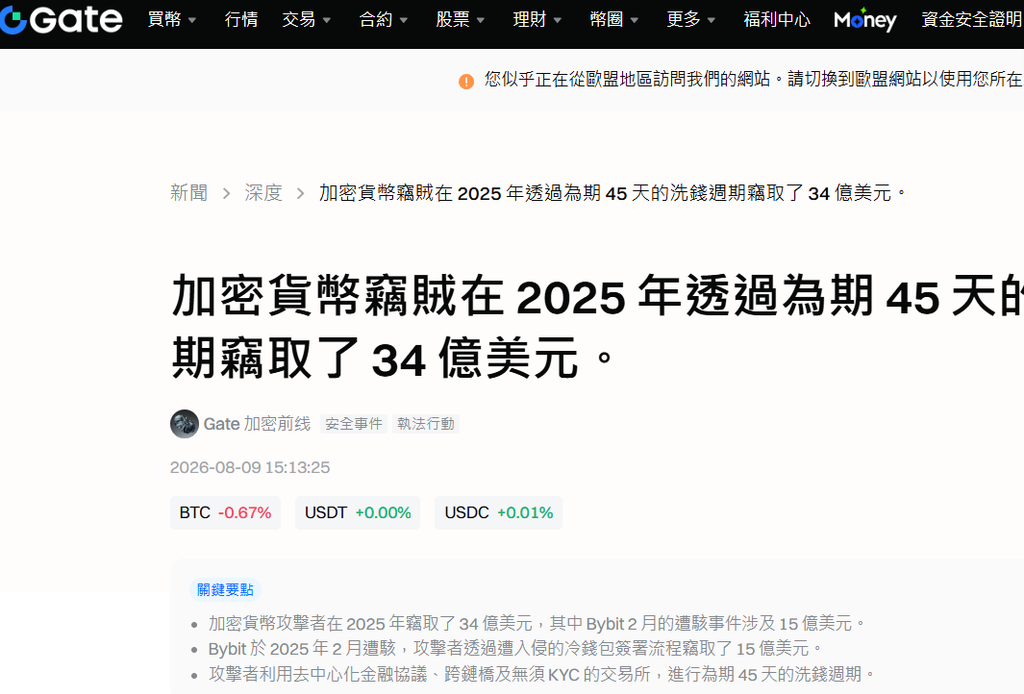
The risk of hacking of exchange platforms and DeFi protocols is no longer a “residual operational risk”: it has become a systematic pricing factor for any crypto exposure, whether on-balance-sheet, collateral-based, or as a market maker. The cumulative losses from the 24 major incidents recorded between June 2011 and October 2026 amount to approximately 10.945 billion USD, including 6.3 billion USD for the single Binance episode of October 2026. The extreme concentration of the distribution tail, the Bybit episode of February 2025 alone accounted for 44% of the losses in 2025 and 32% of the cumulative losses for 2024–2025, invalidates any classical mean-variance approach.
The problem that investors, treasurers and regulators pay us to solve is threefold:
- Quantify ex ante the probability and severity of an “extreme loss” event on a given platform counterparty, taking into account the dependence between platforms (liquidity contagion, correlation of state attack vectors).
- Properly price the cost of this risk in yield strategies (yield farming, market making, collateral posting), that is, turn a qualitative “safety” judgment into a quantified cyber risk spread, comparable to a CDS spread.
- Reduce the reaction time between detection of an on-chain anomaly and deactivation of an exposure, which is currently measured in hours, while sophisticated attacks execute in less than 20 minutes across 10 blockchains simultaneously.
The service we offer is deliberately simple in its interface | a daily counterparty cyber risk index (Crypto-Counterparty Cyber Risk Index, CCCRI), broken down by platform and by aggregated portfolio | but it relies on a heavy quantitative architecture. It is distributed through a direct institutional channel (API, terminal, regulatory reports) to risk desks, crypto treasuries and compliance functions, with outreach to regulators via prudential stress tests.
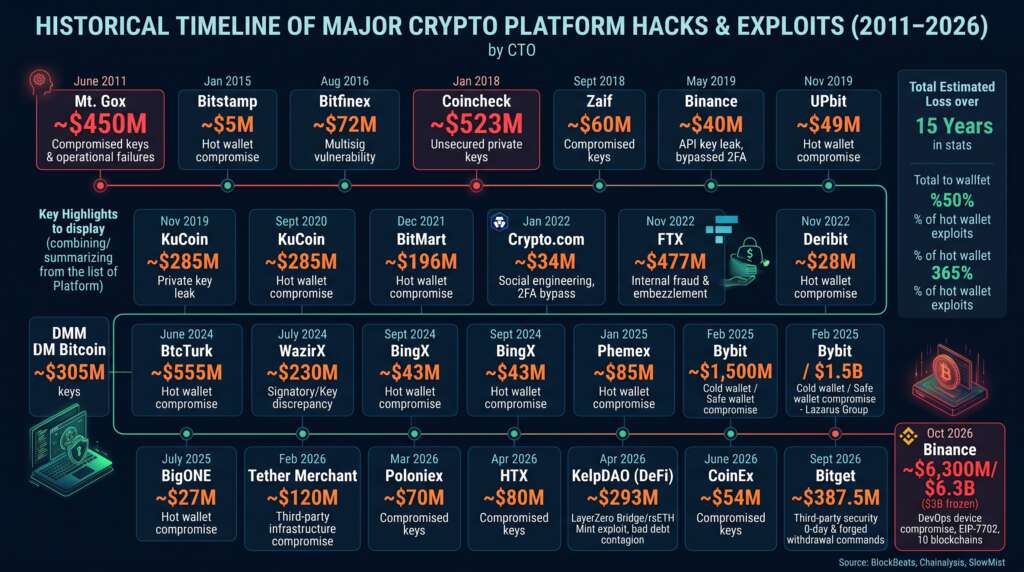
The table reconstructs the chronology of major incidents on centralized exchanges (CEX) and, from 2026 onward, on critical DeFi protocols, with amounts in nominal USD at the time of the incident unless otherwise noted, the primary source for 2011-2026 being the BlockBeats inventory, supplemented by Chainalysis and SlowMist for 2025-2026. The incidents listed range from the key compromise at Mt. Gox in June 2011 (≈$450M, 850,000 BTC) to that at Binance in October 2026 (≈$6.3B gross, ≈$3B frozen) across 10 blockchains via a DevOps device and EIP-7702.
In between, notable incidents include Bitstamp in January 2015 (≈$5M), Bitfinex in August 2016 (≈$72M), Coincheck in January 2018 (≈$523M NEM), Zaif in September 2018 (≈$60M), Binance in May 2019 (≈$40M, 7,000 BTC), UPbit in November 2019 (≈$49M ETH), KuCoin in September 2020 (≈$285M), BitMart in December 2021 (≈$196M), Crypto.com in January 2022 (≈$34M), FTX in November 2022 (≈$477M, internal fraud), Deribit in November 2022 (≈$28M), DMM Bitcoin in May 2024 (≈$305M BTC), BtcTurk in June 2024 (≈$55M), WazirX in July 2024 (≈$230M), BingX in September 2024 (≈$43M), Phemex in January 2025 (≈$85M), Bybit in February 2025 (≈$1.5B ETH, attributed to Lazarus), BigONE in July 2025 (≈$27M), a Tether merchant in February 2026 (≈$120M), Poloniex in March 2026 (≈$70M), HTX in April 2026 (≈$80M), KelpDAO in April 2026 (≈$293M, with Aave contagion), CoinEx in June 2026 (≈$54M), and Bitget in September 2026 (≈$387.5M, via third-party zero-day).
Three regimes follow one another: 2011-2019, that of private keys and operational immaturity, with unit losses below ≈$0.5B USD and a dominant vector of hot wallet or API key compromise; 2020-2025, that of state-sponsored industrialization, with Lazarus emerging and changing the scale (losses in the billions, Bybit 2025, and in 2025, $2.02B out of $3.4B stolen, ≈60%, attributed to Lazarus); 2026, that of the distributed attack surface and DeFi-CeFi contagion, illustrated by KelpDAO (bridge flaw, liquidity shockwave on Aave), Bitget (dependence on a third-party zero-day), and Binance (compromise of a DevOps device, EIP-7702, gross $6.3B of which about half was frozen on-chain).

Theoretical framework: from mosaic theory to tail modeling
Mosaic theory holds that informational value resides not in a single signal but in the aggregation of public and private fragments that reveal vulnerabilities or intentions. Applied to crypto platforms, it provides the epistemological framework for the detection mechanism. The mosaic degree M_t(p) for a platform p at time t is derived from a non-additive aggregation (e.g., copula or Choquet operator) of nonlinear transformations φ_j of fragment sources (on-chain logs, security provider telemetry, governance signals, stablecoin movements, bridge governance data), weighted by coefficients ω_j calibrated via maximum likelihood on historical incidents.
Two individually innocuous fragments can become critical when combined. The approach aligns with the WEF Global Cybersecurity Outlook 2025 recommendation and with BIS work on exchanges as “shadow banks.”
The empirical loss distribution for 2011–2026 is heavy-tailed and non-stationary. Gaussian VaR at 99% underestimates risk: for Bitcoin, it is ≈8.1% daily versus ≈10.5% empirically. Losses L are modeled as a power-law process P(L>x)∼ℓ(x)x^(-α), with α∈(0,2). Work by Cirillo (2022) shows this form better captures “billion-dollar” events. The expected shortfall ES_κ(L) for a Pareto tail is (α/(α-1))VaR_κ(L) when α>1. Three incidents above $1 billion in 20 months (Bybit, KelpDAO with direct loss and contagion, Binance) suggest a regime change. A stability test of the Chow or sup-F type rejects stability at the 1% level. A Markov regime-switching model (HMM) is introduced for (α_t, σ_t) with three states, Low Risk, Moderate Risk, High Risk/State-Sponsored, with transition probabilities from Hamilton filtering.
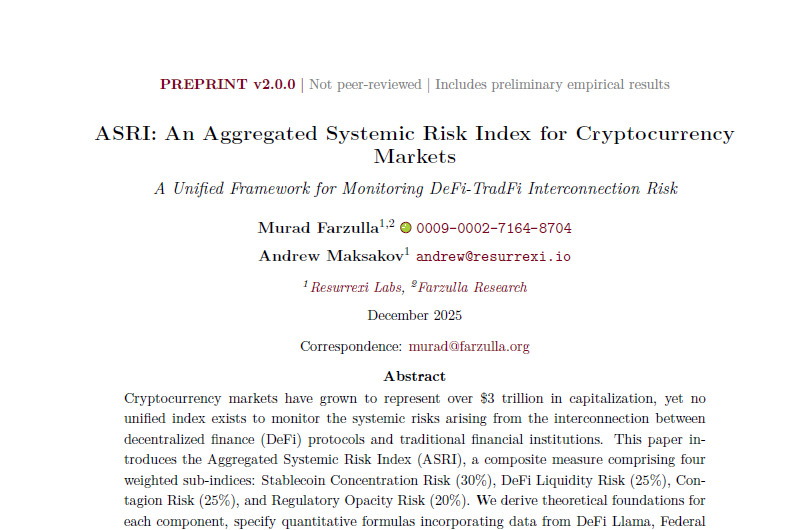
SIR-replicator model for systemic risk and ASRI index
Transmission between platforms is not limited to return correlation but operates through liquidity and collateral channels. When a platform i experiences a loss, it may liquidate collateral, suspend withdrawals, or propagate impairment to assets it holds, affecting platforms j that are exposed to the same assets or counterparties. Recent literature models this phenomenon with a delayed SIR system coupled with the replicator equation from evolutionary game theory. S_i, I_i, R_i are the fractions of healthy functional capacity, compromised and restored for platform i, β_i the transmission rate, δ_i the recovery rate, γ_i the immunity loss rate and τ the detection delay. This computes an epidemic threshold R0(i)=β_i/δ_i: if R0(i)>1, a local event becomes systemic. At the same time, the ASRI index is used, aggregating four weighted sub-indices | Stablecoin Concentration Risk (30%), DeFi Liquidity Risk (25%), Contagion Risk (25%), Regulatory Opacity Risk (20%) | with a three-regime HMM labeling. The ASRI provides an aggregate stress metric that can be monitored daily and compared with preventive thresholds.
The CCCRI is a daily index for each covered platform (CEX and DeFi), featuring a predictive 30-day loss distribution and cyber risk spread. It consists of four modules: M1 aggregates multiple sources (on-chain governance, telemetry, stablecoin flows, market signals). M2 estimates the conditional loss distribution using a Pareto generalized distribution, dependent on HMM state (Low, Moderate, High). M3 calculates a contagion matrix and systemic VaR, with Monte Carlo simulations for events with probability <10⁻³. M4 prices the spread (λ) as marginal cost exposure. The integrated decision w* solves a program with concentration, liquidity, and resilience constraints.
CCCRI: Cyber Risk Counterparty Index
Quantitative projections 2026-2028 of crypto losses
The 2026-2028 projections, based on the current regime (HMM High Risk) and a calibration on the 2025-2026 tails, assume partial stationarity: tail parameters are maintained, but attack intensities follow a log-linear trend. The annual gross loss CEX + DeFi, realized at ≈ $3.4 billion in 2025 and estimated at ≈ $8-9 billion in 2026, is projected at ≈ $6.5 billion in 2027 and ≈ $7.2 billion in 2028, with a 95% VaR of ≈ $14 billion in 2028. The number of incidents > $100M rises from 4 in 2025 to 7 in 2026, then 6 in 2027 and 7 in 2028, with a VaR of 10. The share attributable to state actors is ≈ 60% in 2025, ≈ 65-70% in 2026, ≈ 65% in 2027, ≈ 60% in 2028, and 80% for VaR. The probability of an incident > $5B over 12 months, < 5% in 2025, is ≈ 15% in 2026, ≈ 12% in 2027, ≈ 14% in 2028, and 25% for VaR. The median on-chain freeze time goes from ≈ 10-20% in 2025 to ≈ 40-50% in 2026, then ≈ 50% in 2027, ≈ 55% in 2028, with 30% for VaR (low tail).
The interpretation indicates that the probability of a Binance-type event (≥ $5B) has risen from < 5% before 2025 to ≈ 12-15% in 2026-2028, becoming a medium-frequency risk to be explicitly provisioned. On-chain freeze capacity improves (Binance froze ≈ $3B out of $6.3B), but remains below 50% of gross loss, leaving a net loss on the order of a billion for uninsured depositors in a major incident.
The risk of hacking crypto platforms has shifted from an idiosyncratic operational risk to a first-order systematic risk factor, whose tail distribution is dominated by state actors and security supply chain failures. 2025–2026 data invalidates classic VaR approaches and requires regime-conditional modeling, mosaic aggregation of weak signals, and explicit pricing of the cyber risk spread.
The CCCRI service meets this need with a simple interface (a score, a distribution, a spread) and a deep quantitative engine (conditional generalized Pareto, tail copulas, SIR–replicator, HMM, Esscher transformation). Its distribution channel is natively institutional | API, regulatory reports, integration into risk limits | ensuring rapid adoption by desks, treasuries, and compliance functions.