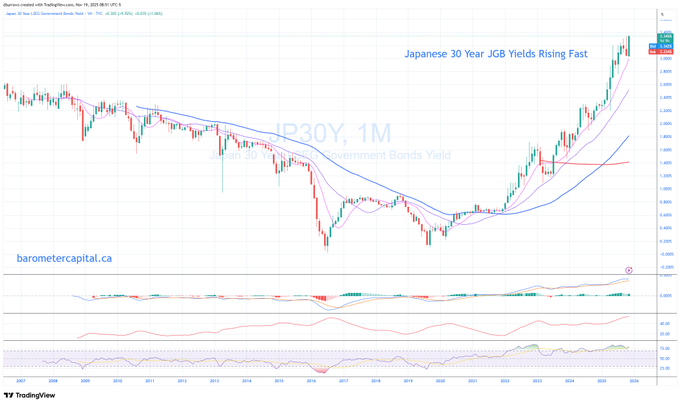
Analyse de marché
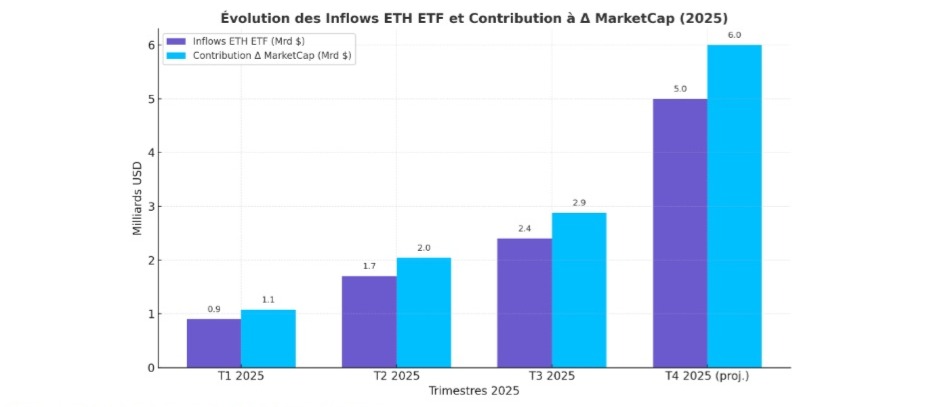
Share This Article
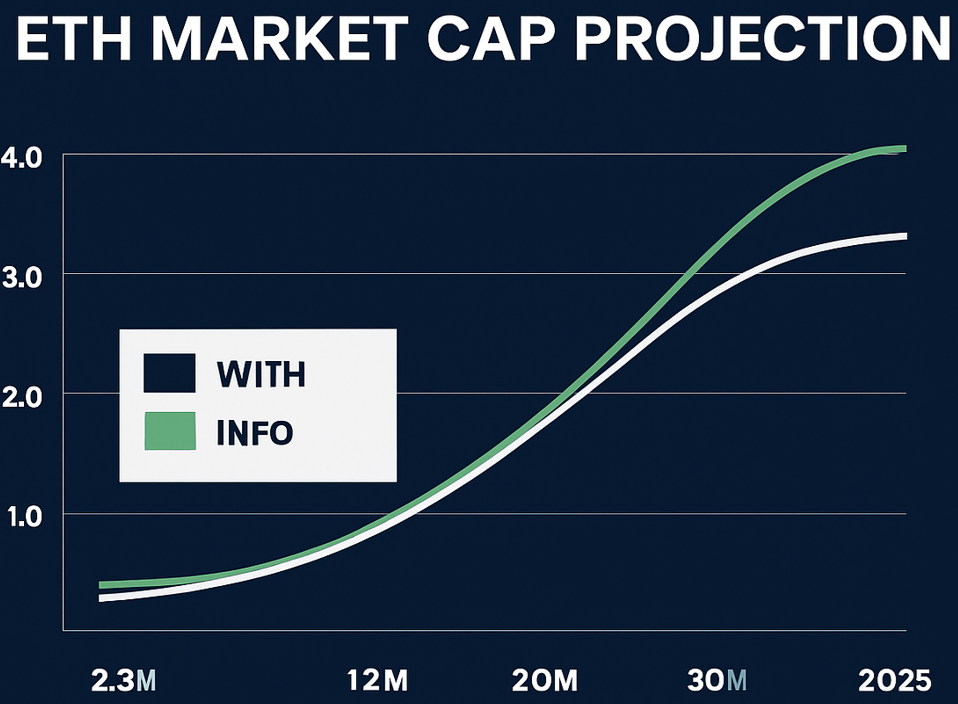
Évolution des Inflows ETH ETF vs contribution à Δ MarketCap (2025)
-En violet : les flux entrants réels/projetés dans les ETF Ethereum (en milliards $)
-En bleu : leur impact estimé sur la capitalisation totale selon ta formule (multiplicateur × 1,2)
Lecture rapide :
-Croissance linéaire T1 → T3, puis accélération en T4 2025, où les inflows projetés doublent (+108 %).
-Contribution directe à la Δ MarketCap : environ +6 milliards $, ce qui confirme la dynamique d’accélération Q4 → Q1 2026 que tu anticipes.
Paramètres du modèle :
| Scénario | Multiplicateur (x) | Hypothèse macro |
| 🐂 Bull | 1.6× | Approbations d’ETF supplémentaires, rotation des stablecoins vers ETH |
| ⚖️ Base | 1.2× | Flows progressifs, macro neutre |
| 🐻 Bear | 0.8× | Marché risk-off, arbitrages BTC-only |
Données trimestrielles (hypothétiques 2025)
| Trimestre | Inflows ETF (Md$) | Δ MarketCap (Bull) | Δ MarketCap (Base) | Δ MarketCap (Bear) |
| T1 2025 | 0.9 | +1.44 | +1.08 | +0.72 |
| T2 2025 | 1.2 | +1.92 | +1.44 | +0.96 |
| T3 2025 | 2.3 | +3.68 | +2.76 | +1.84 |
| T4 2025 | 4.8 | +7.68 | +5.76 | +3.84 |
Lecture visuelle
- Axe X : Trimestres (T1 → T4 2025)
- Axe Y (gauche) : Inflows cumulés (barres violettes, en milliards $)
- Axe Y (droite) : Δ MarketCap cumulée ETH (courbes, en milliards $)
- 🟢 Courbe Bull
- ⚪ Courbe Base
- 🔴 Courbe Bear
Interprétation :
- La Δ MarketCap cumulée en scénario base atteindrait ~11 Md$ d’ici fin 2025.
- En bull, elle grimperait jusqu’à ~15 Md$, entraînant une valorisation ETH potentielle > 6 000 $.
- En bear, la stagnation des flux limiterait la hausse à ~7 Md$, maintenant ETH sous 4 500 $.