Share This Article
1. EXECUTIVE SUMMARY – 30-SECOND PITCH
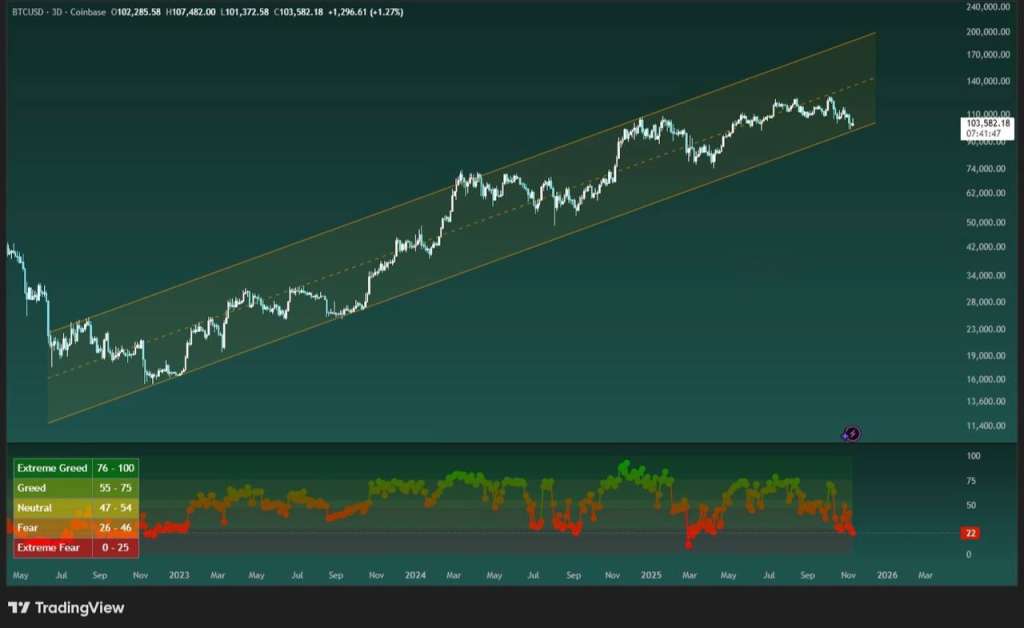
- Price: $103,500 (▲ +1.3 % 24 h) – inside $101-110 k bull-flag.
- Thesis: Sequential validation of (i) macro tail-winds, (ii) on-chain supply shock, (iii) option gamma + short-squeeze set-up above $1Ᵹ7 k → $1Ᵹ0 k first target.
- Probability: 65 % break-out, 25 % range extension, 10 % channel failure.
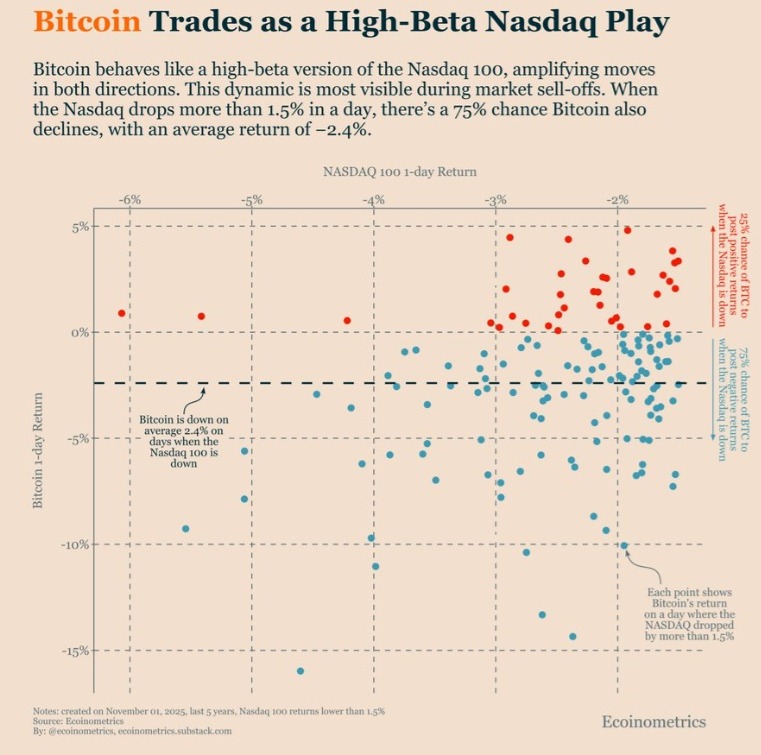
2. MACRO – BTC vs NASDAQ HIGH-BETA MODEL
| Metric | Current | 5-Y Avg | Signal |
| Nasdaq 100 1-day ret < -1.5 % | 75 % prob BTC ↓ -2.4 % avg (ECoinometrics) | 70 % | Beta = 1.6× – no decoupling |
| US 10-yr yield | 4.45 % (▼ -30 bps 6 w) | 4.8 % | Tail-wind for duration assets |
| DXY | 102 (▼ -3 pts 6 w) | 103 | USD weakness → BTC ↑ |
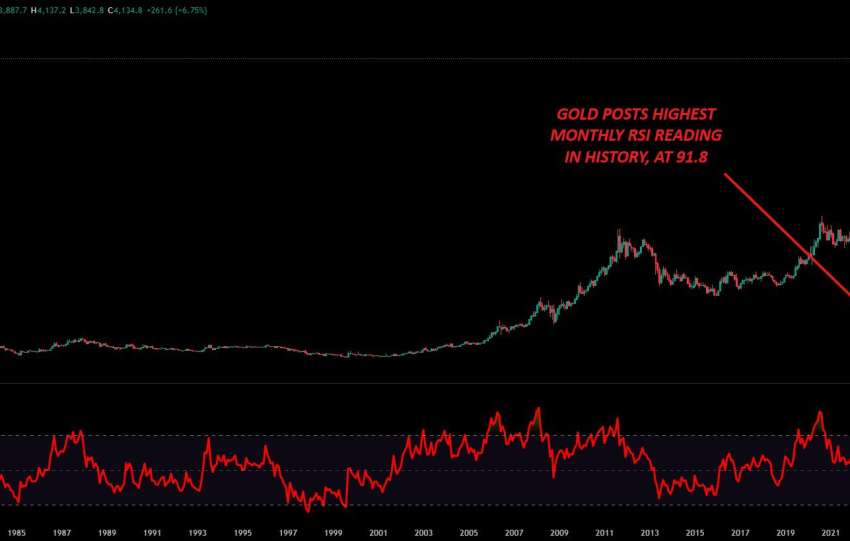
| Gold/BTC ratio | 0.58 (▼ -12 % 3 m) | 0.68 | BTC outperforming monetary metals |
| Fed cut pricing | 2 cuts 2026 | 1 cut | Liquidity supportive |
Conclusion: Macro backdrop positive for high-beta Nasdaq proxy = BTC.
3. MICRO-STRUCTURE – SUPPLY SHOCK INVENTORY
| Indicator | Value | 30 d Δ | Signal |
| Exchange reserve BTC | 2.50 M | -400 k (-12 %) | Largest 30-day decline since 2020 |
| Illiquid supply | +350 k BTC | +2.1 % | Whales cold-storage |
| LTH Net Position Change | +36 k BTC | Positive 21 days | Long-term holders accumulate |
| Stablecoin Supply Ratio (SSR) | 6.2 | ▼ -15 % | More USD dry-powder vs BTC float |
| Liquidity Inventory Ratio | 0.68 | ▼ -10 % | Order-books thinner → explosive moves |
Interpretation: Real inventory scarcity + USD liquidity = combustible for upside breakout.
Steelldy Newsletter
Receive complete and useful Tax, Economic, and Financial studies by email for the management of your business.