Analyse de marché
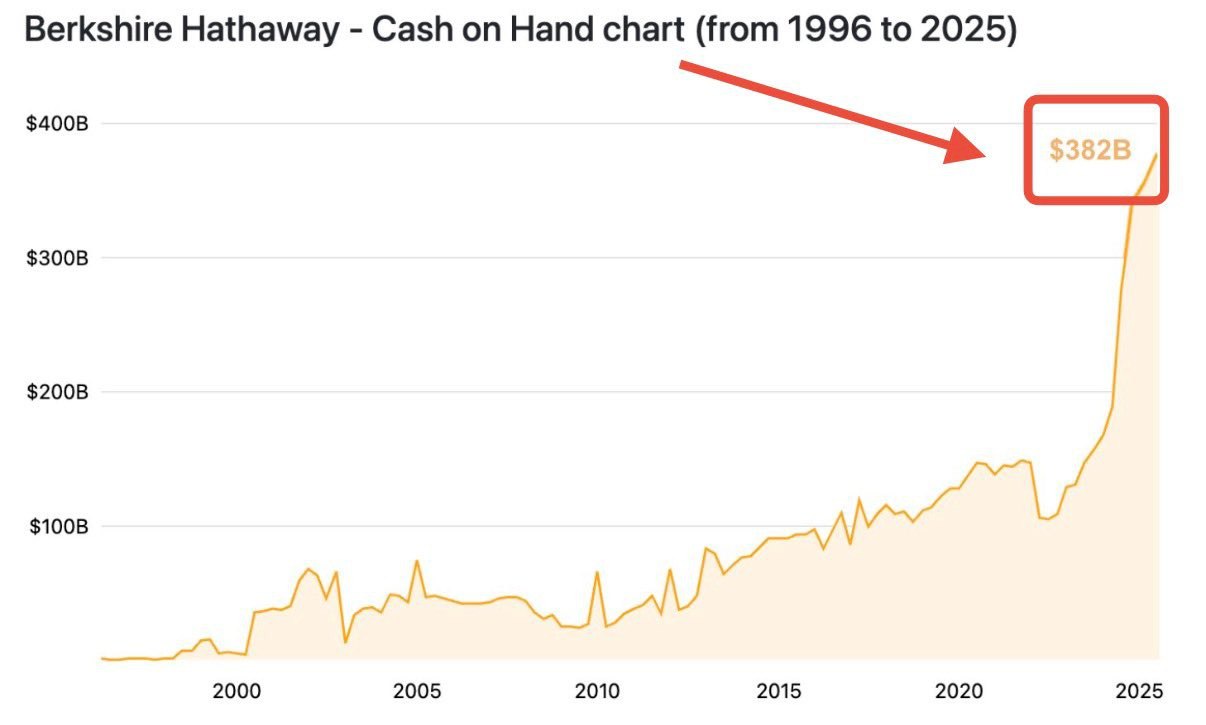
Share This Article
1. CASH POSITION ANALYSIS
Current Cash: $189B
% of Assets: 18% (vs 10% normal, 15.5% avg pré-crise)
Signal Strength: +16% above historical pre-crisis average
Historical Context:
├─ 2007 Pre-Crisis: $44B (15%) → 8 months to crisis, SPX -57%
├─ 2019 Q4 Pre-COVID: $128B (16%) → 4 months to crisis, SPX -34%
└─ 2025 Current: $189B (18%) → ??? months to crisis, SPX -??%
Interpretation: Extreme Warning “Highest defensive cash position in Buffett’s 60-year history”
2. SECTOR ROTATION ANALYSIS
Major Changes (2022-2025):
├─ Financials: -35% (EXIT regional banks, reduce BAC)
├─ Technology: -15% (Trim Apple despite being largest holding)
├─ Energy: +18% (Inflation hedge)
├─ Utilities: +8% (Defensive)
└─ Cash: +85% (DRY POWDER accumulation)
Pattern: Classic pre-crisis rotation Cyclicals/Growth → Defensives + Cash Historical Analogue: 2007-2008 Buffett made similar rotation 6-12M before financial crisis
3. IMPLIED MARKET VIEW
Excess Cash: $84B (beyond normal 10%).
Opportunity Cost: $4.2B/year forgone Implied
Expected Decline: ~35-40%
Timeline: 6-18 months
Interpretation: Buffett is willing to forgo $4.2B annual returns to maintain dry powder. This implies he expects significant market dislocation offering 15%+ IRR opportunities within 12-18 months.
4. BUFFETT INDICATOR
Current Reading: 1.85 (Market Cap / GDP)
Long-Term Average: 0.85
Deviation: +118% above mean Implied
Overvaluation: 54%
Historical Context:
├─ 2000 Dot-com Peak: 1.40
├─ 2021 Bubble Peak: 2.05
├─ 2025 Current: 1.85 (still in bubble territory)
└─ Fair Value: 0.85 (implies 54% overvaluation)
Signal: Extreme Overvaluation
Market would need to decline ~54% to reach historical mean.
Warren Buffett is positioning for a Major market dislocation:
Evidence:
✓ Record $189B cash (18% of assets)
✓ Aggressive selling of financials (-35%)
✓ Reduction of tech exposure (-15%)
✓ Rotation to defensives (energy, utilities, staples)
✓ Buffett Indicator at 1.85 (extreme overvaluation)
✓ Pattern matches 2007 pre-crisis positioning Implied View:
– Market overvalued by 35-50%
– Crisis probable within 6-18 months
– Sectors at risk: Financials, Tech, Cyclicals
– Opportunity:
¤ deploy $84B+ at crisis lows
Historical Accuracy
2007: Positioned defensively → Deployed aggressively 2008-2009
2019: High cash → COVID crash → Massive buying opportunity
2025: highest cash ever → Expecting largest opportunity?
When the greatest investor in history raises cash to record levels, exits financials aggressively, and foregoes billions in returns, prudent investors should pay attention.