1. CASH POSITION ANALYSIS
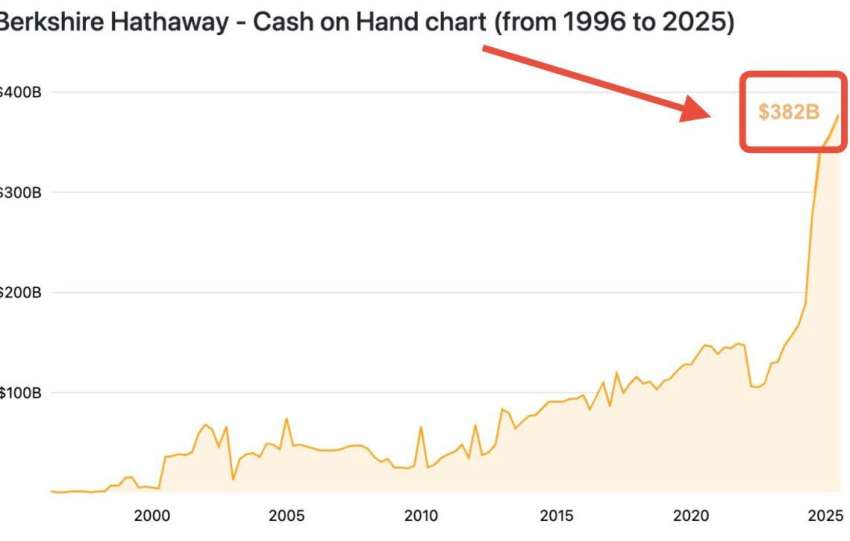
Current Cash: $189B
% of Assets: 18% (vs 10% normal, 15.5% avg pré-crise)
Signal Strength: +16% above historical pre-crisis average
Historical Context:
├─ 2007 Pre-Crisis: $44B (15%) → 8 months to crisis, SPX -57%
├─ 2019 Q4 Pre-COVID: $128B (16%) → 4 months to crisis,…
Thèse principale
Nous avons atteint la phase terminale de la bulle IA 2.0, qui présente des ressemblances structurelles avec la bulle dot-com, cependant dissimulée par une liquidité abondante et une concentration intense au sein du S&P 500.
Le Bitcoin se présente comme l'actif anti-bulle qui est rare, décentralisé, non admissible au sauvetage financier,…
I. MACRO DIAGNOSIS: THE EUPHORIA BUBBLE IS QUANTIFIED
The chart and data confirm that the phrase "this time it's different" is, as historian Kindleberger documented, the peak signal of a speculative mania.
1. The Shiller Indicator (CAPE): The Sword of Damocles
• The Fact: The CAPE ratio (Cyclically Adjusted Price-to-Earnings Ratio) is…
Analyse de marché