Analyse de marché
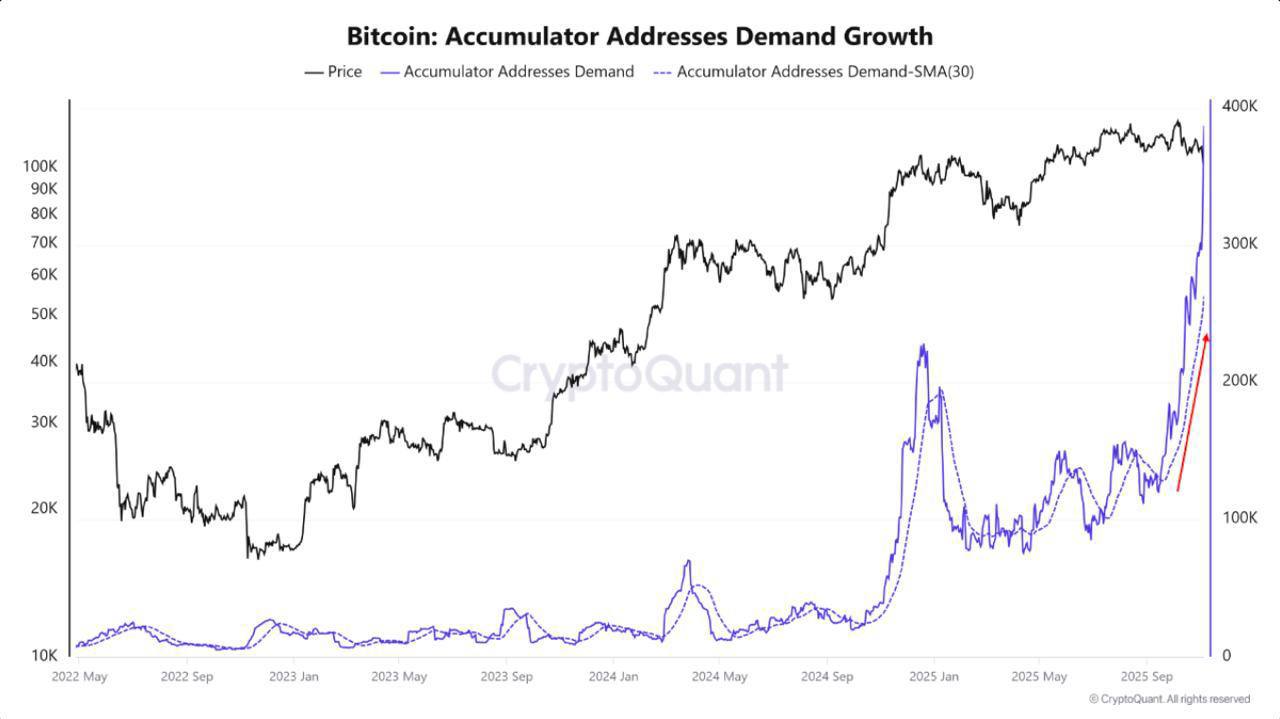
Share This Article
I. OPERATIONAL SUMMARY: THE CLEAN SWEEP
A. Context: From 26K to $89K, is it really a Bear Market or a Final Reset?
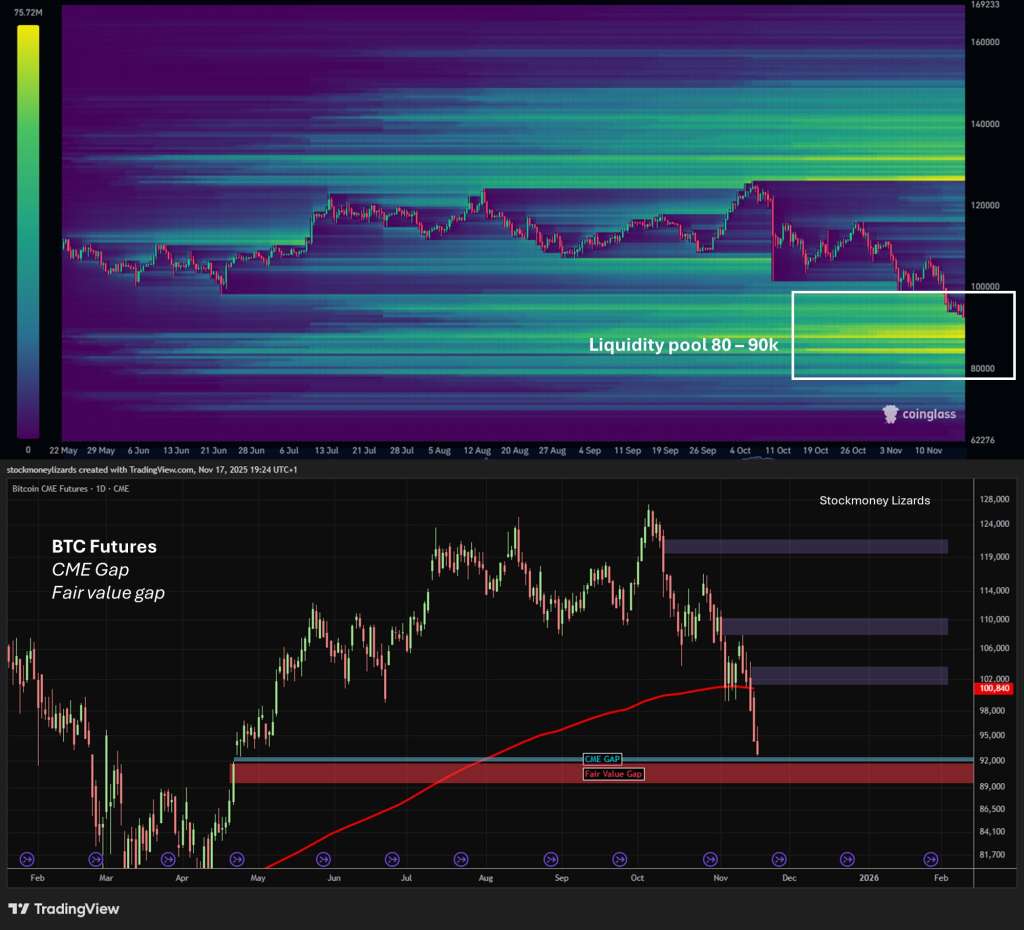
The 30% correction from the October peak (above 26,000) to the $89,000 zone is not a Bear Market. It’s a final Clean Sweep that resets the market before the parabolic growth phase.
B. Confluence On-Chain: Whales Are Buying Every Dip
CryptoQuant, Glassnode data and our previous analyses identified institutional accumulation masked by Retail liquidation. The provided data confirms that this accumulation is now parabolic and systemic.
C. Verdict
« The $88,000 – $92,000 zone is the must-not-miss entry price of the cycle. This is the trade of the century. »
II. ADVANCED ON-CHAIN ANALYSIS: PARABOLIC ABSORPTION
The market is controlled by the supply and demand of high-conviction entities. Retail panic is effortlessly absorbed by structural capital.
A. The Law of Inverted Supply and Demand
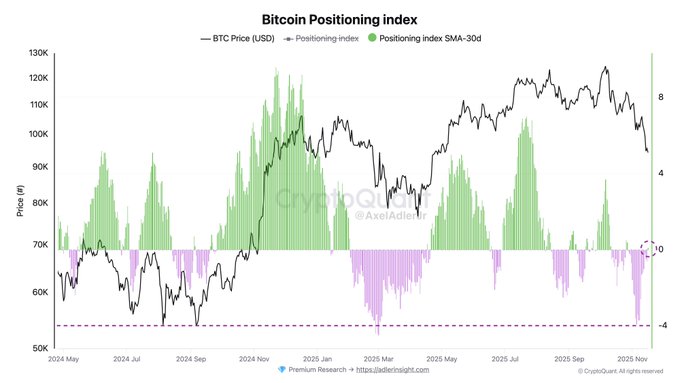
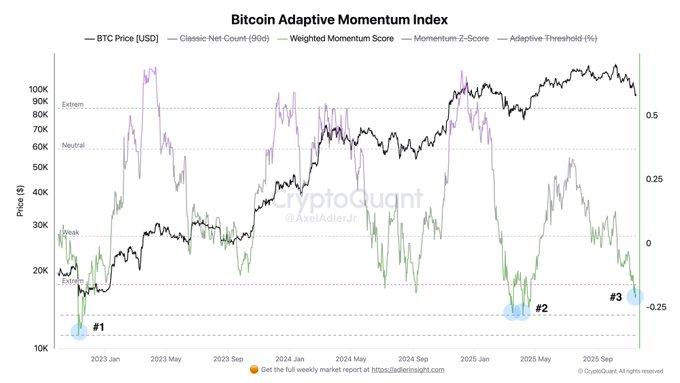
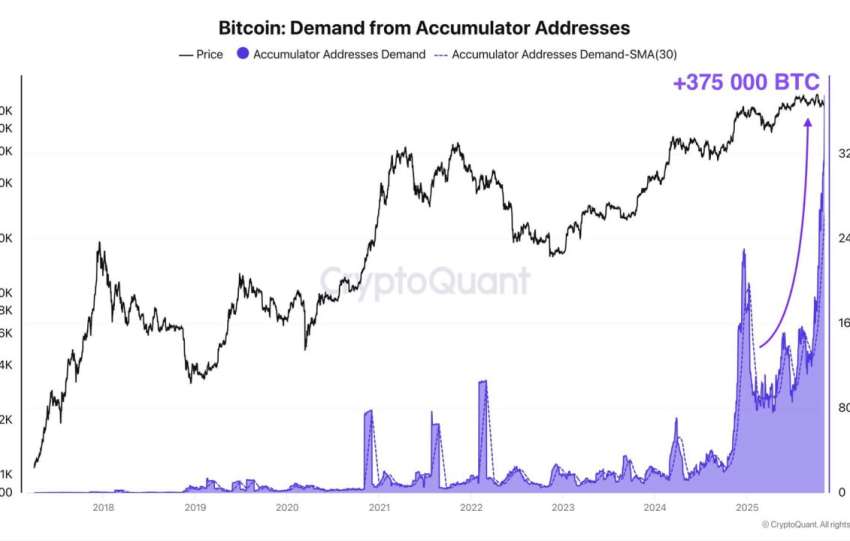
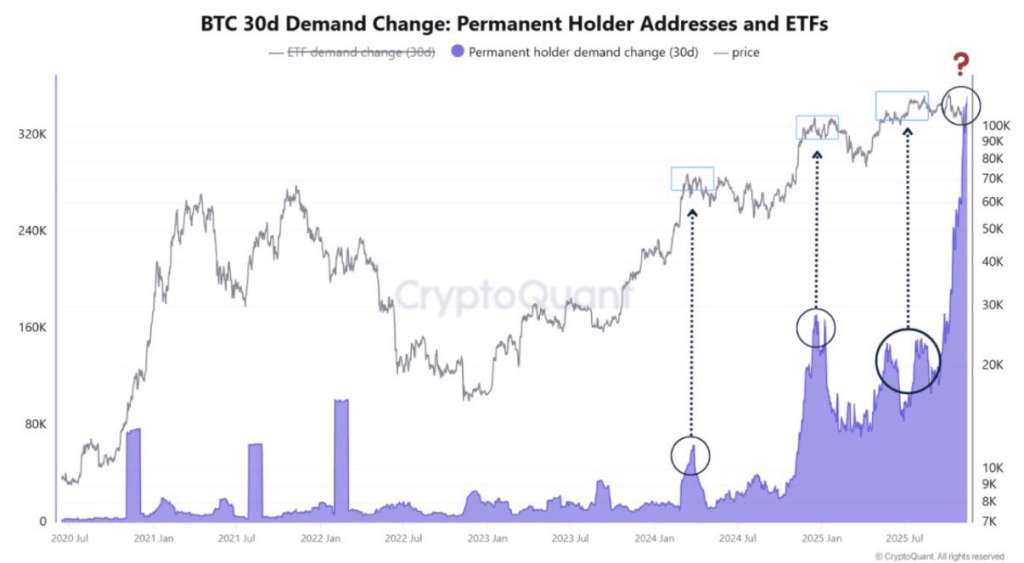
The CryptoQuant chart (increase in demand from Permanent Holders coinciding with the drop in prices) validates a critical market condition:
Whale Demand X 1/Price * Volatility
Interpretation. The greater the volatility and the price drop, the more the Whale Demand increases. The correction is their preferred buying window.
B. The Numbers That Prove Total Absorption
| On-Chain Metric | Value | Significance |
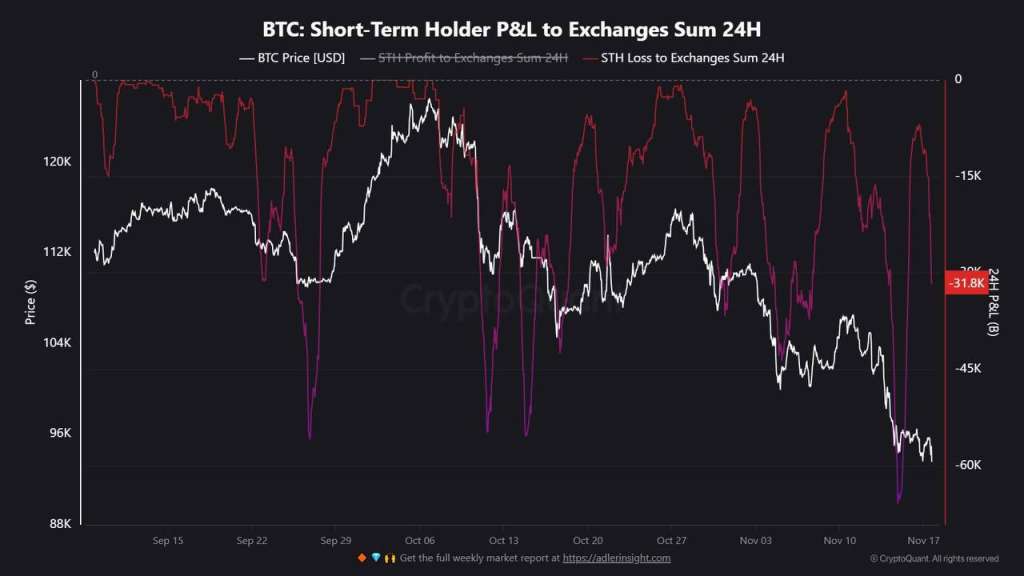
| STH Losses to Exchanges (24H) | -31,8K BTC | MAXIMUM retail capitulation |
| LTH Distribution (30d) | 815 000 BTC vendus | Healthy profit taking post-rally |
| Whale Accumulation (1 week) | +45 000 BTC | 2nd biggest accumulation in 2025 |
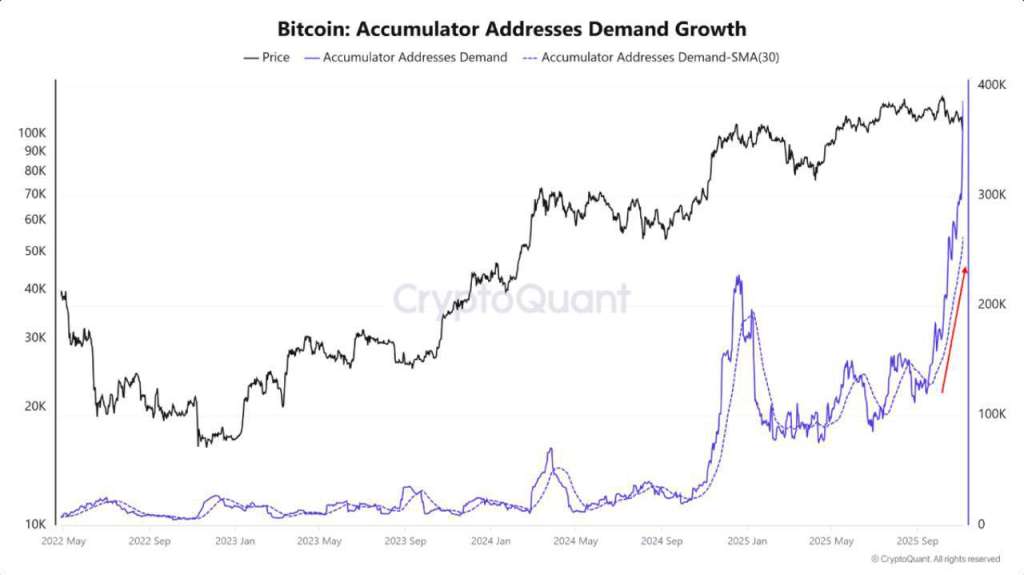
| Accumulator Addresses Demand | +400K (parabolique) | Never seen level since 2021 |
| Permanent Holder Demand (30d) | Vertical explosion | Smart money in FULL BUY mode |
| Exchange Reserves | -400K BTC (30d) | Real supply shock |
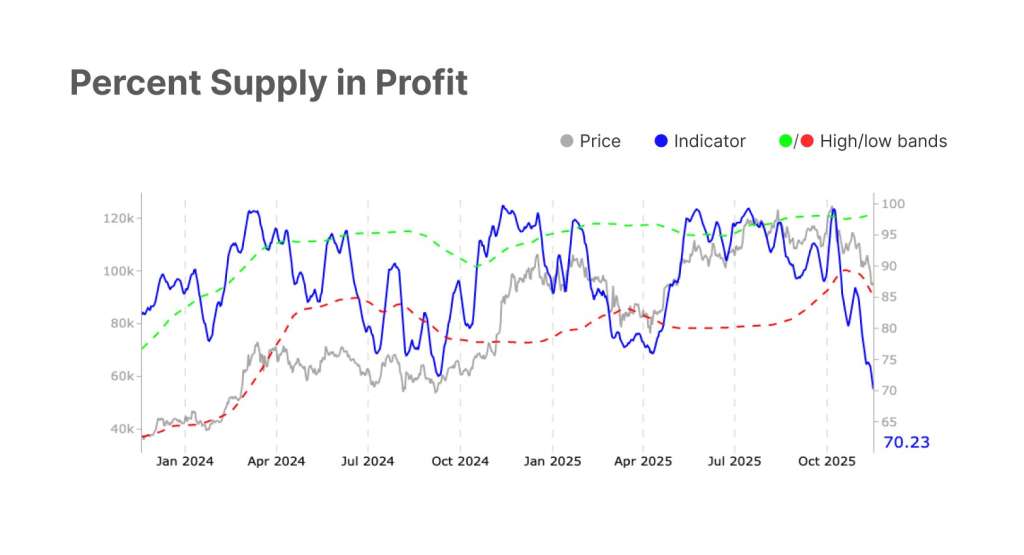
| STH Supply in Loss | 2,8M BTC underwater | Highest level since FTX |
C. Real-Time Wealth Transfer
Result:
The $2.9 billion sold at a loss by STHs (Short-Term Holders) entirely flowed into the hands of:
• Institutional funds
• Bitcoin ETFs
• Wealthy investors (HNWI)
• Corporate treasuries (MicroStrategy: +8,178 BTC this week = $835M)
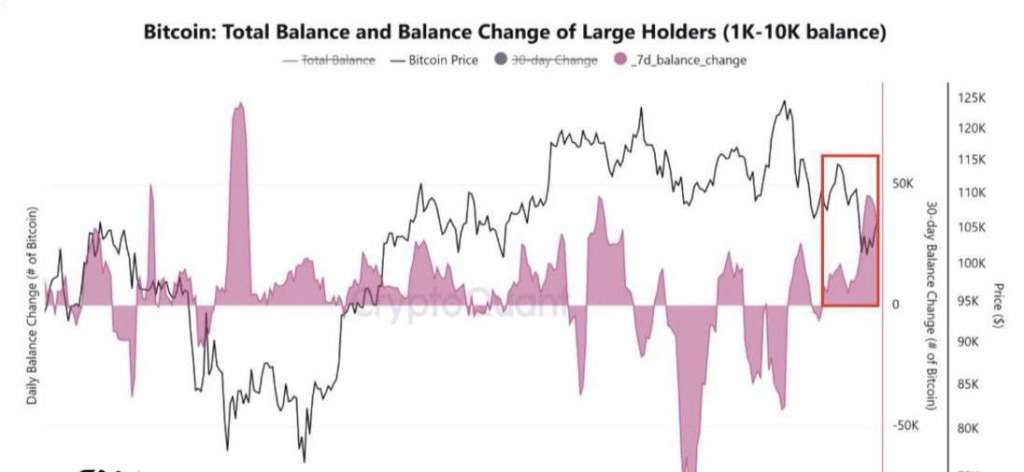
Whales accumulated 45,000 BTC last week, marking the second-largest weekly accumulation in 2025, while short-term holders now collectively hold about 2.8 million BTC at a loss, the largest underwater position recorded since the FTX collapse in late 2022. The Bitcoin supply is becoming illiquid at an exponential rate.
III. RETAIL VS INSTITUTIONS DIVERGENCE — THE ULTIMATE SIGNAL
A. Retail: Maximum Panic
| Indicateur Retail | Value | Interpretation |
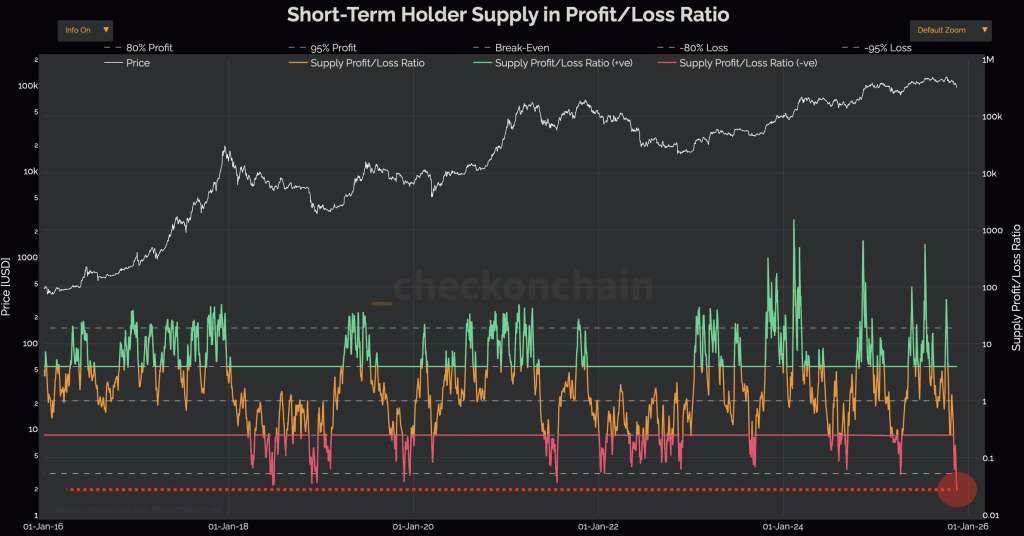
| Fear & Greed Index | 11 (Extreme Fear) | Maximum panic |
| STH P/L Ratio | < 0,1 | 80% of STHs sell at a loss |
| Social Sentiment | FUD extreme | « C’est »It’s a bear market! » |
| ETF Outflows (Nov) | $2,8 Md sortis | Retail exits ETFs |
| Exchange Deposits | -31,8K BTC/24H | Capitulation sale |
B. Institutions: Parabolic Accumulation
Institutional Indicator Value Interpretation
| Indicateur Institutional | Valeur | Interprétation |
| ETF Holdings (BTC terms) | 1,33M BTC (vs 1,38M peak) | Only -3,6 % stable |
| Whale Wallets (1K+ BTC) | +45K BTC this week | Bulk purchase |
| Accumulator Addresses | Parabolic Explosion | Smart money ALL-IN |
| MicroStrategy | +8 178 BTC ($835M) | Continuous purchase |
| Total Holdings 1K+ BTC | 1,76M BTC (vs 1,52M 2025) | +16% annual accumulation |

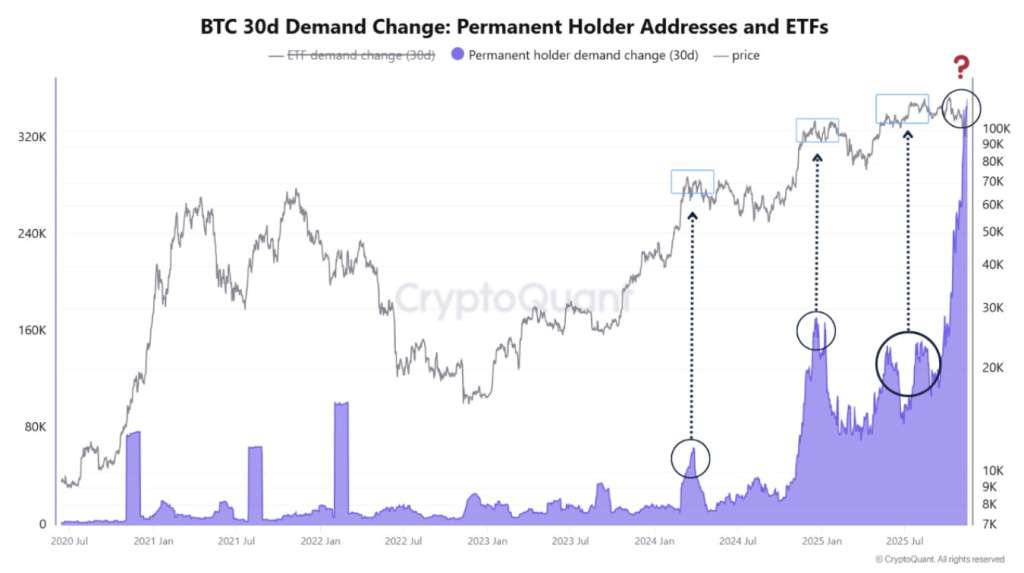
The data suggests a growing conviction on the part of large and small entities that Bitcoin is undervalued at current levels.
C. The Divergence That Never Lies
Confirmed historical pattern:
📉 Retail sells (Fear = 11)
↓
📈 Institutions buy (Parabolic Accumulation)
↓
🚀 Result: Structural Bottom + Imminent Short Squeeze
Steelldy Lesson: « Smart money buys the fear while Tetail sells into strength. This divergence defines every Bitcoin cycle. »
IV. NO DISTRIBUTION OF LTHS — THE KEY SIGNAL
A. On-Chain Truth about LTHs
Long-Term Holders (LTHs) of Bitcoin are capitulating at the fastest pace in nearly a year, offloading 815,000 BTC in 30 days. But, and this is crutial, there is No massive distribution on exchanges.
B. Why This Is Bullish and Not Bearish?
| Scenario | What Would Happen | What Is Really Happening |
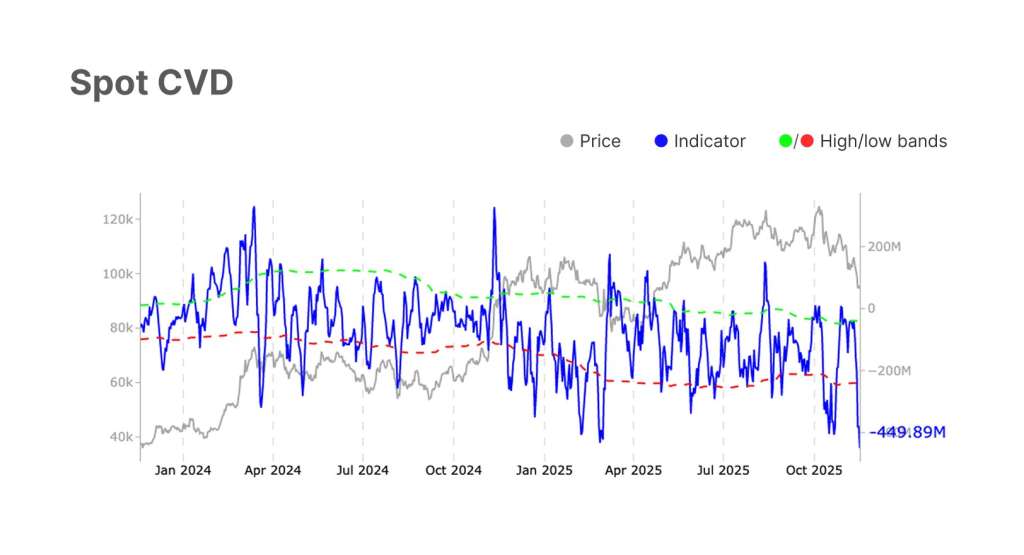
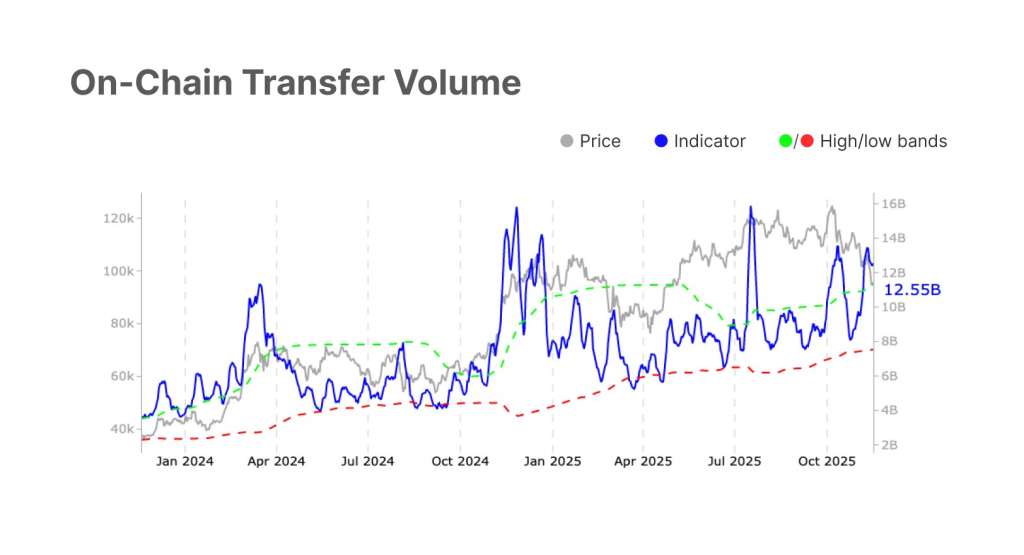
| LTH True Panic | ➡️ Massive deposits on exchanges ➡️ Spot CVD explodes positively ➡️ Exchange reserves rise | None of these signals |
| Healthy Profit Taking | ➡️ Direct OTC sales ➡️ No exchange pressure ➡️ Whales instantly buy | Exactly what is happening |
LTH Divergence
The 815,000 BTC offloaded by LTHs are a healthy profit-taking after a parabolic rise to $126K. But the Net Flow to Exchanges remains Neutral or Negative.
This means:
√ Distribution by former HODLers is largely over
√ Their profit is being reabsorbed by the New Institutional Wave
√ The market is under total institutional control.
Assets under management of US ETFs have only dropped by about 4% compared to the 25% BTC price drop, highlighting a divergence.
C. Technical Lesson
If LTHs were truly panicking, we would see:
• Spot CVD exploding positively (massive selling)
• Exchange reserves soaring
• Fear & Greed at 0 (absolute terror).
This is not the case. The market is being absorbed, controlled, and ready for a rebound.