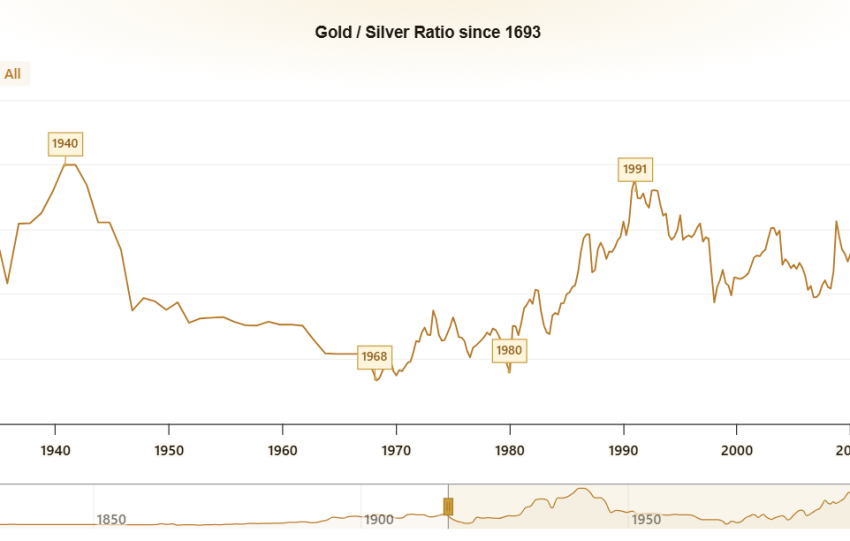
Skip to content Skip to sidebar Skip to footer

Site icon Economie

Toute l’actualité économique et financière en France et dans le monde. Vidéos, analyses, interviews.

Category image

Economie

Toute l'actualité économique et financière en France et dans le monde. Vidéos, analyses, interviews.

Detailed view of an industrial plumbing system featuring multiple pressure gauges and steel pipes.

Trans-Saharan Gas Pipeline (TSGP) in the Context of European Disengagement from Russian Oil/Gas and Global Oil Demand Reduction: Quantitative Strategic Assessment

Executive Summary The Trans-Saharan Gas Pipeline (TSGP) — a 4,128 km project linking Nigerian gas fields (Warri region) through Niger to Algeria’s Hassi R’Mel hub, with onward connection to European markets via existing Algerian infrastructure — represents a geostrategic diversification play for Europe amid categorical reduction of Russian fossil fuel dependence (oil imports down…

Read more

Industrial plant with reflection in water at twilight, showing smoke stacks and lights.

Refinery Activity and Supply Chain Integrity

Executive Summary Satellite signatures combined with AIS vessel tracking and OSINT currently indicate elevated refinery activity in US/Europe amid global disruptions, but severe anomalies in Middle East tanker flows through the Strait of Hormuz. As of mid-June 2026, Hormuz transits are near-historic lows (often <10 vessels/day, down 70-97% from baseline), with widespread "dark" operations…

Read more

Aerial landscape shot of a coastal oil refinery with storage silos under cloudy skies.

BIS/WEF Context on Transition Risks Compressing Long-Term Refining Margins: Carbon Tracker-Style Analysis and Quantitative Projections for TotalEnergies

Executive Summary Transition risks under 2°C pathways (IEA NZE/APS equivalents) drive structural demand destruction for refined products, compressing refining margins via volume contraction, utilization drops, and policy/carbon cost overlays. Carbon Tracker’s foundational 2017 “Margin Call” analysis projected >50% EBITDA decline by 2035 for ~94% of global capacity under a 2D scenario (oil demand -23%…

Read more

SpaceX Dragon spacecraft in orbit, highlighting advanced space technology with cloud backdrop.

Liquidity Trap Scenario : Gold < $4,150, Oil ~$88 Stabilization – Integration with SpaceX IPO Retail Influx and Systemic Market Crash Risks

Executive Summary The posited Liquidity Trap manifests as a regime where elevated nominal asset prices (gold near recent highs, equities at stretched valuations) coincide with forced liquidations driven by margin calls, collateral constraints, and retail FOMO entry, without corresponding real-economy liquidity expansion. Under conditions of gold stabilizing below $4,150/oz and WTI/Brent oil around $88/bbl (current…

Read more

A dimly lit TotalEnergies gas station at night in Nairobi, Kenya, featuring prominent signage.

Refiner Margin Squeeze and the 3:2:1 Crack Spread Signal: Technical Analysis with Focus on TotalEnergies (as of mid-June 2026)

Executive Summary The 3:2:1 crack spread serves as a primary proxy for gross refining margins, calculated as: 3:2:1 Crack Spread=2×PGasoline (bbl)+1×PDistillate/Heating Oil (bbl)−3×PCrude (bbl)3\text{3:2:1 Crack Spread} = \frac{2 \times P_{\text{Gasoline (bbl)}} + 1 \times P_{\text{Distillate/Heating Oil (bbl)}} - 3 \times P_{\text{Crude (bbl)}}}{3} where prices are typically futures-settled (e.g., WTI/RBOB/NYH HO for USGC benchmarks; Brent equivalents or regional baskets for Europe).…

Read more

Two gold bars rest on a pile of US dollar bills, symbolizing wealth and prosperity.

Inflation Surge Crushes Gold & Silver Amidst Geopolitical Turbulence

Gold prices have plummeted, trading near $4,078.00, down 4.26%, and silver near $63.605, down 2.66%, following Wednesday's trading close. This decline is attributed to a higher-than-expected May inflation report, rising Treasury yields, and escalating US-Iran tensions, which have overshadowed demand for safe-haven assets. US consumer prices rose 0.5% in May and 4.2% year-on-year, with core…

Read more

Silver vs. Gold: When and Why Silver Often Takes the Lead

Silver, a unique hybrid asset (monetary, industrial, speculative, linked to energy transition), exhibits higher volatility than gold. Its price is influenced by monetary demand, industrial demand, physical supply, and real interest rates. The primary driver, monetary demand, is linked to real interest rates (nominal rates minus inflation). When real rates are negative, the opportunity…

Read more

A striking illumination of a gold-colored mineral against a dark background, showcasing its intricate details.

Gold Prices Dip, But Fund Manager Sees Long-Term Rally Intact

Excerpt from the article by Neils Christensen The gold market has experienced a downturn, with prices falling below $4,500 and testing the critical 200-day moving average support. Despite this short-term selling pressure, attributed to inflation concerns and speculation of interest rate hikes, one fund manager, Tom Winmill of the Midas Discovery Fund, believes the long-term…

Read more

Close-up of gold bars on a dark background, representing wealth and investment opportunities.

Gold’s New Era: Strategist Predicts Long-Term Bull Market Fueled by Central Banks and Geopolitics

Doug Moglia, a strategist at Rockefeller Global Investment Management, identifies gold as the anchor of a new commodity cycle, projecting its long-term bull market to persist despite recent volatility. Commodities are regaining traction for diversification as structural demand outpaces constrained supply. While broader commodity trends are shaped by electrification, AI, reshoring, energy security, and underinvestment,…

Read more