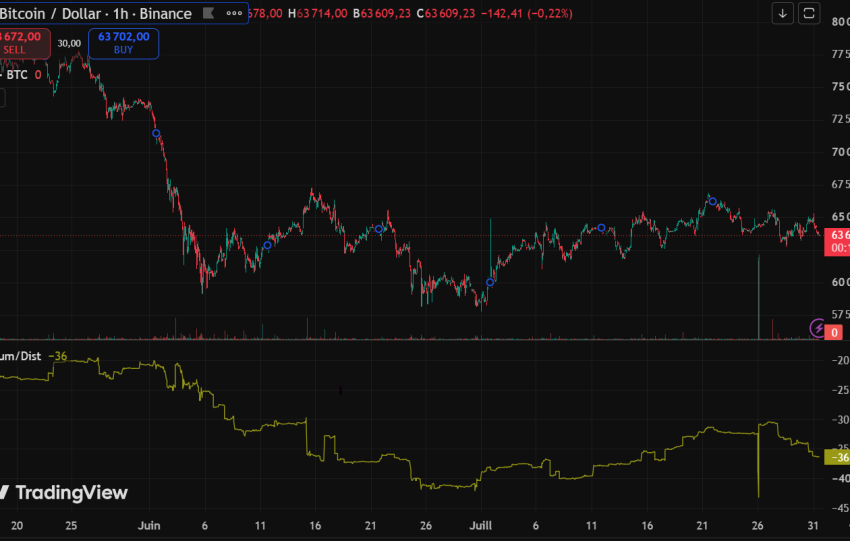
As of April 30, 2026, the Buffett Ratio (Wilshire 5000 / annualized nominal GDP) reached 227%, with a peak high of 232.6% in March. Paul Tudor Jones uses an expanded measure (total market capitalization / GDP) amounting to approximately 252%, incorporating foreign companies listed in the US and tokenized real assets. This ratio, adjusted for…
The distinction between a "trap" and a "trigger" in market analysis centers on their nature, observability, agents involved, and timing.
A trap is a static liquidity configuration, often visible in liquidity heatmaps as bid clusters (e.g., 76K–80K), indicating passive retail accumulation and suggesting resistance (high Kyle's Lambda). This configuration can take hours or days…
Cohort-Normalized CVD (Cumulative Volume Delta): Colored lines reveal that small orders ($100–$10K, green/orange lines) are buying on upward moves, while large blocks ($1M+, purple lines) are selling. Correlation with our April 27th statements : The April 27th post hypothesized a "stealth institutional distribution" in the $77,000–$80,000 range, with a negative delta of –699.51 and a…
Visual Data: Liquidation density concentrated at $75,000 (long cluster) and $80,000–$85,000 (short clusters). 1-week heatmap showing yellow/orange bands (high density) at 75K and 81K+. Current price in a "blue" area (low density), i.e., compression zone.
Correlation with the April 30th study:
The April 30th study modeled a bimodal distribution of liquidations:
Mode…
Visual Data:
¤ Clear resistance zone between $77,400 and $78,000 USD.
¤ Fibonacci 65% at $77,411 USD, 61.8% at $77,196 USD.
¤ Current price below resistance.
Correlation with the April 27th Study: The April 27th study identified the selling wall at $79,000–$80,000…
Visual data: ~750 days after each halving mark a cyclical top.
Subsequent capitulation period: 100–170 days. We are at ~750 days since the April 2024 halving.
Correlation with our previous macro studies: The April 28 study postulated a structural decoupling of BTC/NASDAQ with a negative correlation (–0.42). The April 30 study incorporated the…
Analysis of Glassnode data as of April 30, 2026, reveals an unprecedented structural compression: Bitcoin is "trapped below market mean," trading at approximately $76,000, below the True Market Mean (around $81,500) and the STH Cost Basis (around $83,000), in a "Cooled" zone (-1σ). The Spot Volume Delta (7-day MA) indicates a stabilization of net selling…
The simultaneous withdrawal declaration of Saudi Arabia and the United Arab Emirates from OPEC and OPEC+ (April 28-29, 2026) constitutes the most severe institutional rupture in the oil market since 1985-1986. This study demonstrates that this exit is not a purely bearish signal but rather the prelude to a two-speed structural dislocation:
…
The macroeconomic context of April 2026 is marked by persistent monetary uncertainty, with the 10-year US rate at 4.38% weighing on tech and crypto valuations. A strong dollar (DXY at 104.2) is draining liquidity from emerging and risky markets. The VIX, at 28.4 (+12%), signals a high but manageable risk premium. On the geopolitical front,…
Kepler Cheuvreux has undergone a major strategic transformation since 2020. The integration of Ellipsis AM (Private Equity focused on Small/Mid-Caps) along with the approval of a Private Credit arm (Direct Lending/Structured Credit) of €12 Billion (AUM) currently underway (Run-Rate) represents one of the most successful examples of capital arbitrage and institutional leverage in Europe.
…
Analyse de marché