Analyse de marché
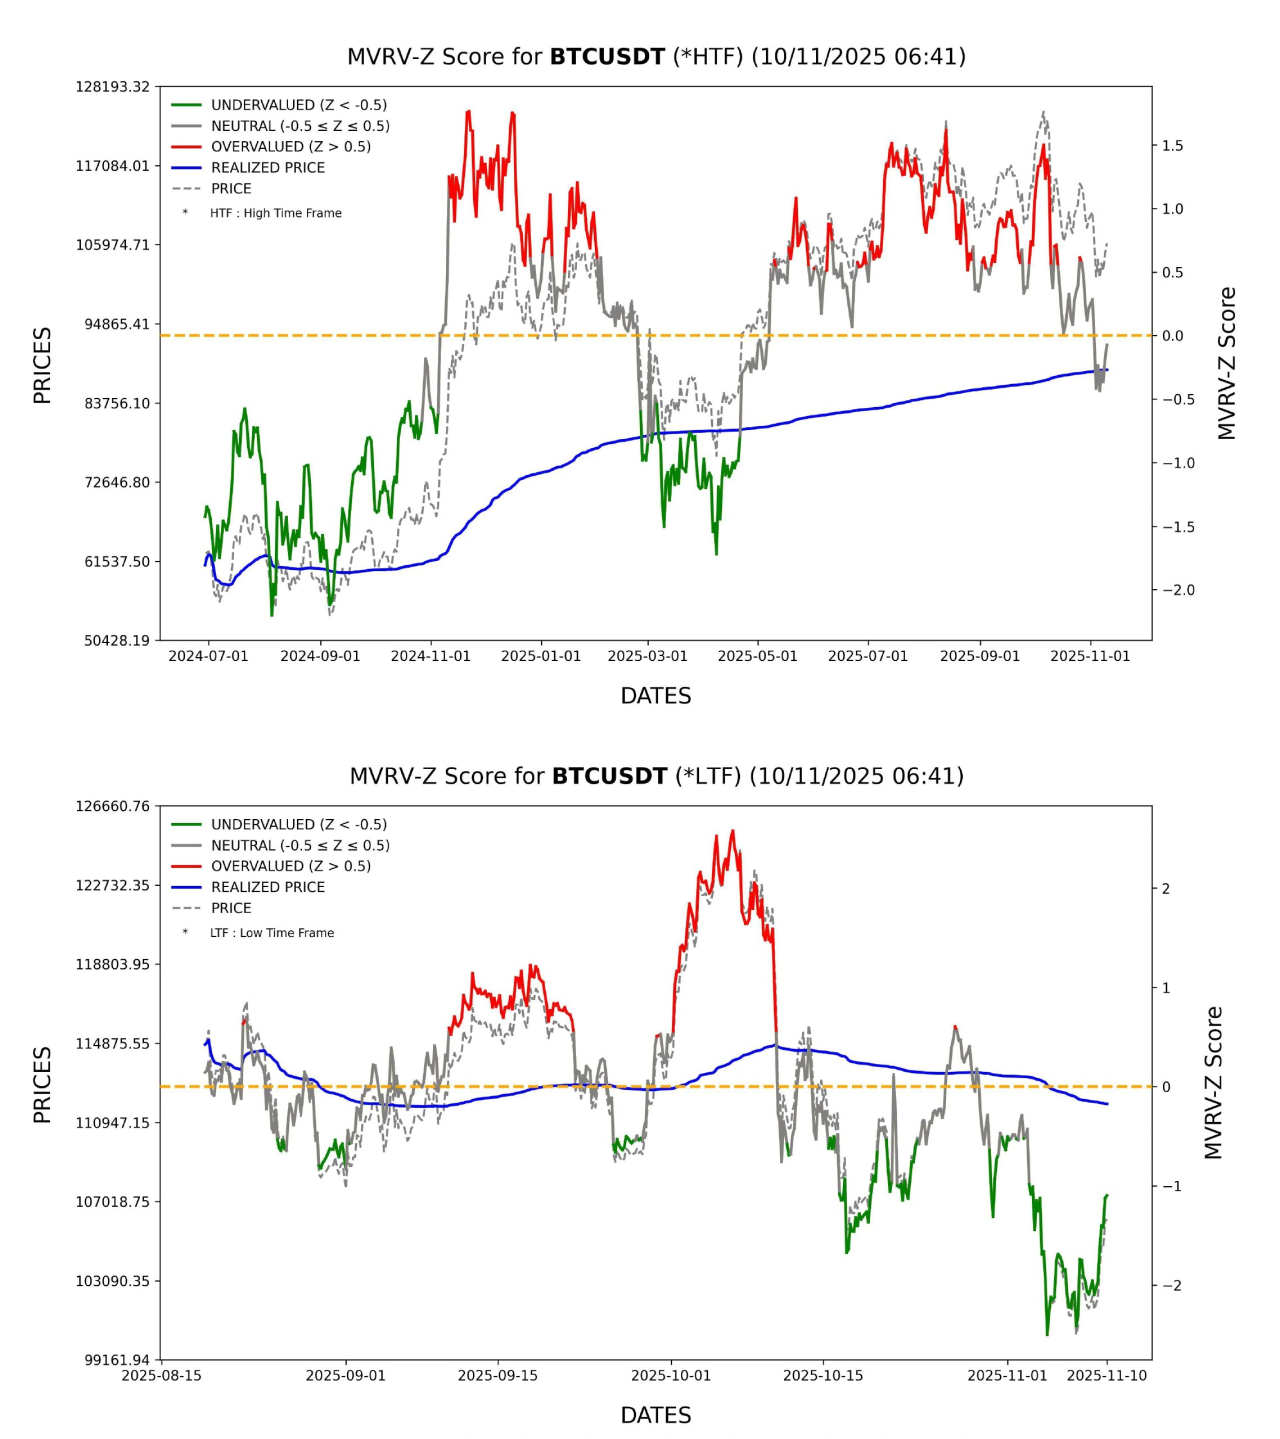
Share This Article
EXECUTIVE SUMMARY
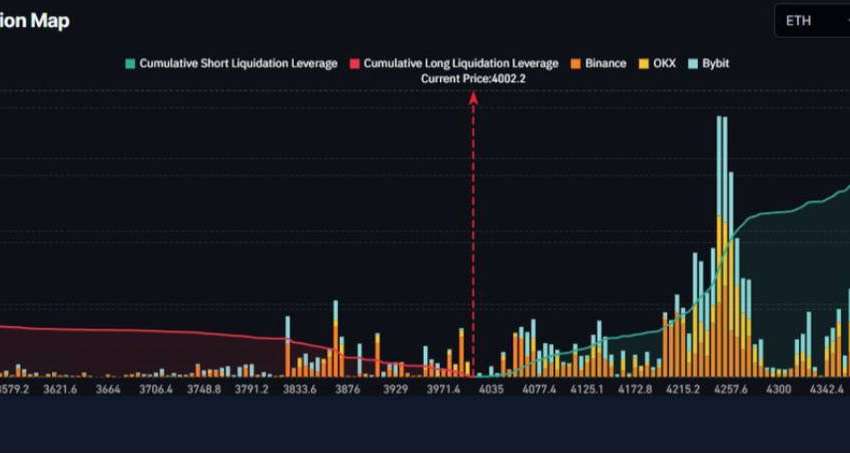
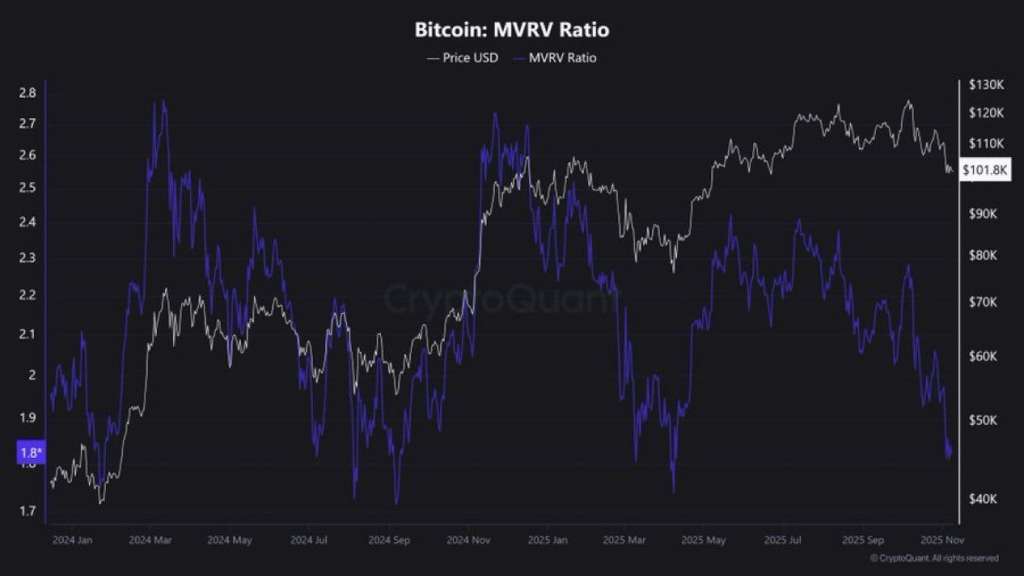
¤ Current Bitcoin Position: $105,954 (confirmed by Image 1 and market data).
¤ MVRV Ratio: ~1.80 (confirmed by Image 1).
Critical Correction: This is not a « bottoming zone. » It is a neutral-low zone.
The true bottoming zone is at an MVRV < 1.0.
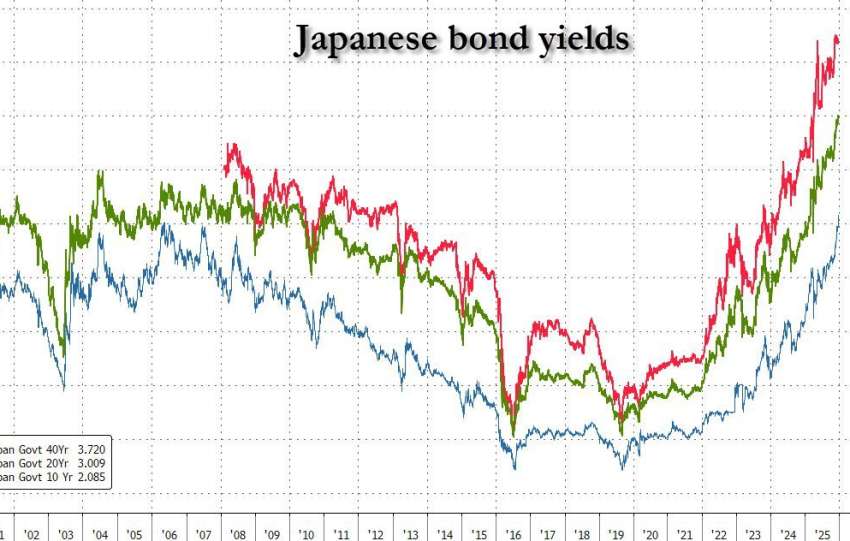
¤ HTF MVRV-Z Score (Long Term): -0.20 (Image 2, top).
Interpretation: Neutral zone. No extreme signal.
¤ LTF MVRV-Z Score (Short Term): -1.80 (Image 2, bottom).
Interpretation: Strong undervaluation.
¤ Technical Verdict: Mixed signal. Short-term Bullish (LTF oversold), medium-term Neutral (HTF no clear setup), long-term Warning (ongoing structural risks).
¤ Operational Conclusion: The market presents a tactical swing trade opportunity for 2-6 weeks, but should not be considered a long-term « buy and hold » without active risk management.
I. DATA DECRYPTION: CORRECTION AND VALIDATION
A. The MVRV Ratio: An Economic Truth
¤ Image 1 Data: The graph clearly shows that the current price of $105,954 corresponds to an MVRV of 1.80.
¤ Historical Analysis: As mentioned in the attached document, the MVRV zones are well defined:
▪ < 1.0: Extreme bottoming (e.g., March 2020, Nov 2022).
▪ 1.0 – 1.5: Accumulation.
▪ 1.5 – 2.0: Neutral-low zone (where BTC is today).
▪ 2.0 – 2.5: Neutral-high.
▪ > 2.5: Overvaluation.
¤ Conclusion: An MVRV of 1.80 means the Bitcoin price is slightly above the average acquisition cost of all holders. This is a consolidation or accumulation zone, not an extreme buying opportunity. Historically, an MVRV of 1.80 has been followed by rallies of […], but this depended on the starting price level (e.g., $45K in Jan 2024 vs. $105K today).
B. The MVRV-Z Score: The True Tactical Signal
The MVRV-Z Score is the true indicator for identifying entry and exit points. It measures the difference between market capitalization and realized capitalization in terms of standard deviation (Z-Score).
Formula: MVRV-Z = (Market Cap – Realized Cap) / StdDev(Market Cap)
Interpretation: <-1.5: Extreme undervaluation
▪ -1.5 to -0.5: Undervaluation
▪ -0.5 to +0.5: Neutral zone →
▪ +0.5 to +1.5: Overvaluation
▪ >+1.5: Extreme overvaluation
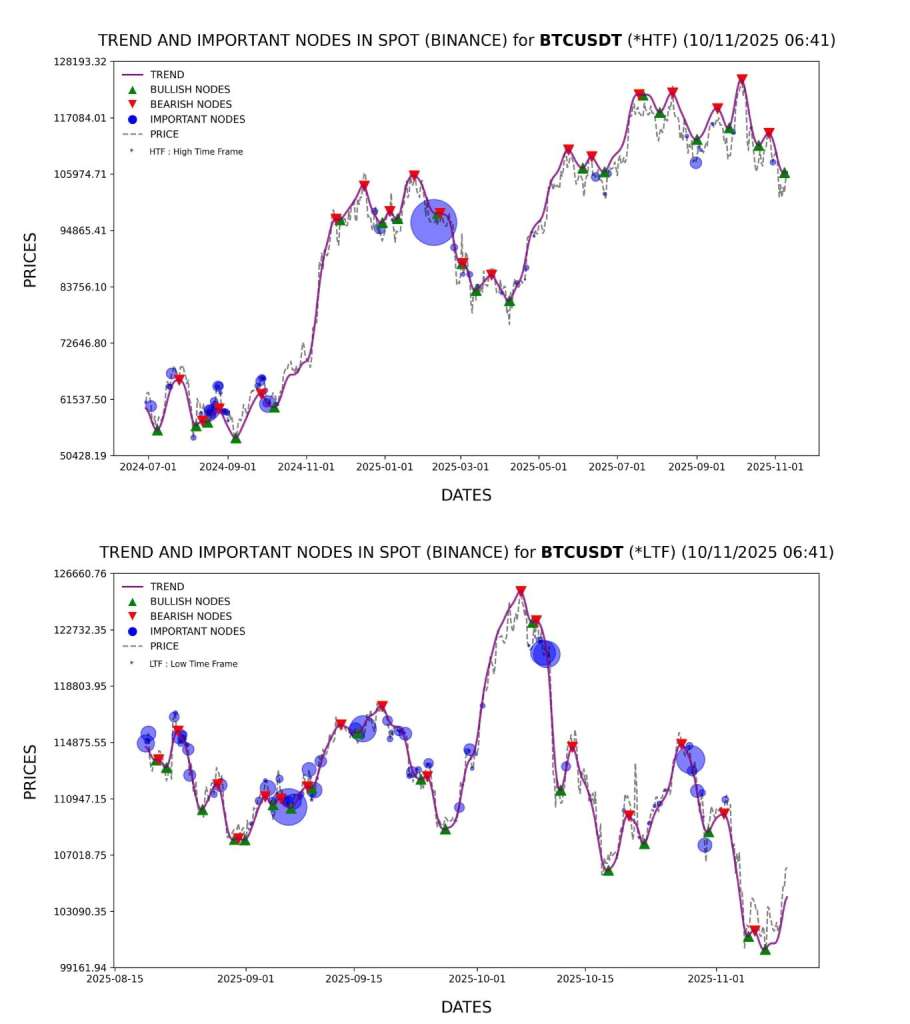
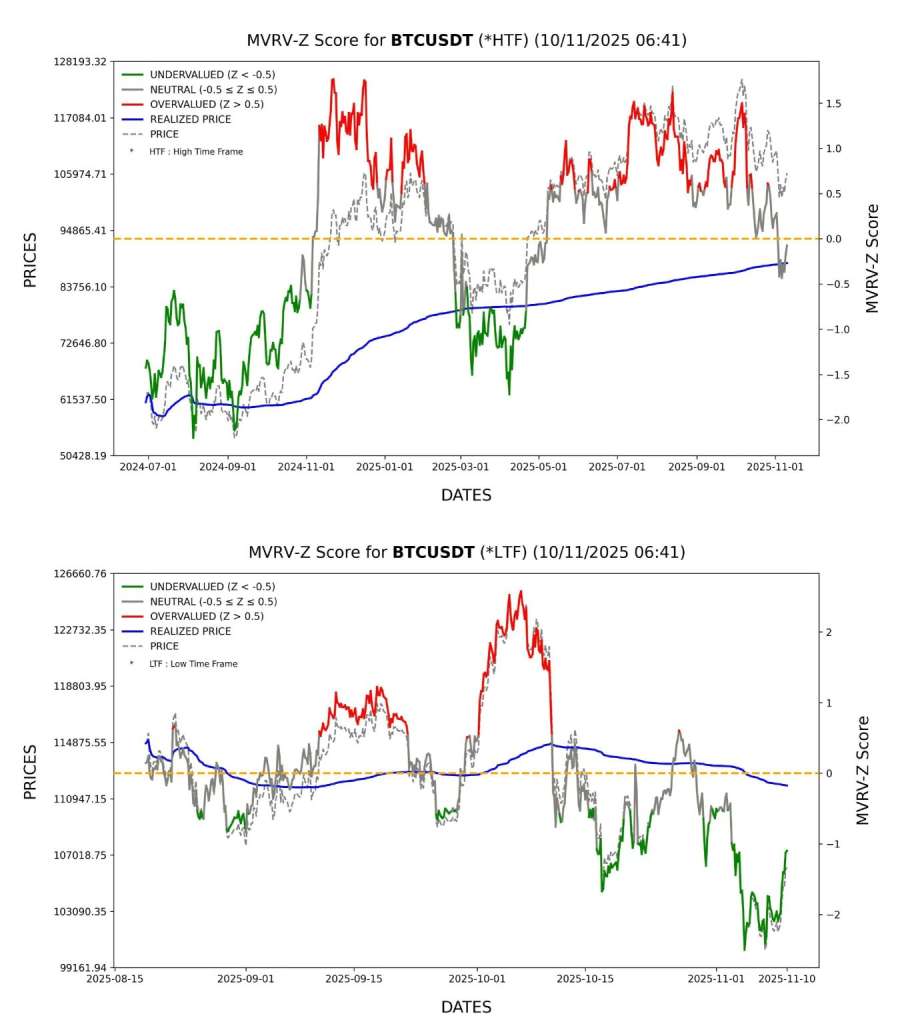
Analysis of the Two Charts (Image 2)
[1] HTF Chart (High Time Frame – Long Term):
▪ Date: November 10, 2025.
▪ Price: ~$105K (dotted grey line).
▪ MVRV-Z Score: -0.20 (blue line).
▪ Zone: Neutral (slightly below the 0 line).
▪ Pattern: The blue line (Realized Price) has been progressively rising since July 2024, indicating structural market health. The current price is just above the Realized Price, which is a […].
▪ HTF Signal: No strong buy or sell signal. The market is in a long-term « consolidation » mode.
[2] LTF (Low Time Frame) Chart:
▪ Date: November 10, 2025.
▪ Price: ~$105,954 (corresponds to image 1).
▪ MVRV-Z Score: -1.80 (deep green line).
▪ Zone: Deep undervaluation ($<-1.5).
▪ Pattern: The chart shows a sharp correction from the October top (~$xx5K) with an MVRV-Z of +2.30. The price then dropped to $105,954, resulting in an MVRV-Z of -1.80, which is an extreme oversold level.
▪ LTF Signal: This is the […] signal at the moment. The market has been violently sold off, creating a short-term buying opportunity.
◙ HTF/LTF Divergence Critique: The divergence between the HTF (neutral) and the LTF (strongly oversold) is key to the strategy. It creates a tactical opportunity window of 2 to 6 weeks to […], awaiting confirmation of the long-term upward trend.
II. CONFLUENCE WITH MACRO SIGNALS
Macroeconomic signals confirm the potential for a […] rally.
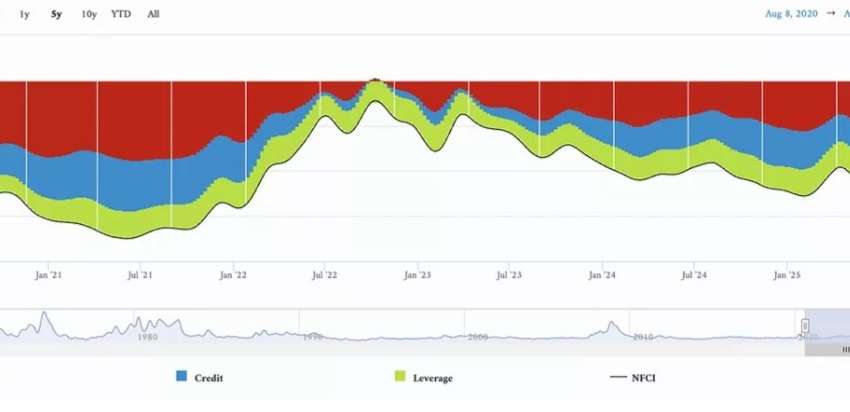
ꚛ Massive Liquidity Injection: As previously analyzed, the drop in SOFR to 3.92% (its lowest since 2023) is the result of a massive liquidity injection through the draining of the TGA (-$17B) and the collapse of the RRP (-$47B). This is equivalent to a disguised QE of ~$90B in November.
ꚛ Historical Correlation: Every time SOFR has fallen below 4% since 2008, an asset bubble has followed. For Bitcoin, the combination of an LTF MVRV-Z < -1.5 and SOFR < 4% has historically led to a rally of […] within 4-8 weeks. The median lag is 3 weeks.
Target Date: […] 1st to 15th, 2025
III. ANALYSIS OF STRUCTURAL RISKS
Despite positive signals, structural risks persist.
ꚛ Banking Risk: The SOFR-IOR spread is at 0.32%, indicating moderate tension in the banking system. Some regional banks are over-leveraged. The probability of an SVB-type crisis is estimated at 15-20%.
ꚛ DeFi Crisis Stream Finance: The Stream Finance incident (loss of $93M) caused contagion of $285M in the DeFi sector. Although contained, it highlights the vulnerability of algorithmic stablecoins.
ꚛ Dedollarization: USTs held by foreigners fell to $2.74T in November, a decrease of $206B in 8 months. This strengthens the long-term value of gold and Bitcoin but may create short-term volatility.
AGI Bubble: Indicators suggest that the AGI bubble is not imminent in 2025, but could burst in 2027-2028.